
- Title
-
In Vitro, In Vivo, and In Silico Analyses of Molecular Anti-Pigmentation Mechanisms of Selected Thai Rejuvenating Remedy and Bioactive Metabolites
- Authors
- Dej-Adisai, S., Koyphokaisawan, N., Wattanapiromsakul, C., Nuankaew, W., Kang, T.H., Pitakbut, T.
- Source
- Full text @ Molecules
|
Total chemical component analysis of remedy extracts, presented in a pile chart (100%) using GC–MS. (A) Metabolites present in 80% ethanol extract. (B) Metabolites present in ethyl acetate extract. 

|

The chemical structures of (A) ethyl-p-methoxycinnamate, (B) glabridin, and (C) kojic acid. |

Determination of glabridin in HPLC chromatogram. (A) HPLC chromatogram of a standard reference at 100 µg/mL concentration. (B) HPLC chromatogram of 80% ethanol extract at 10 µg/mL concentration. (C) HPLC chromatogram of ethyl acetate extract at 10 µg/mL concentration. 230 nm is selected for glabridin detection. The red indicates peaks with a similar retention time to the glabridin standard peak. |
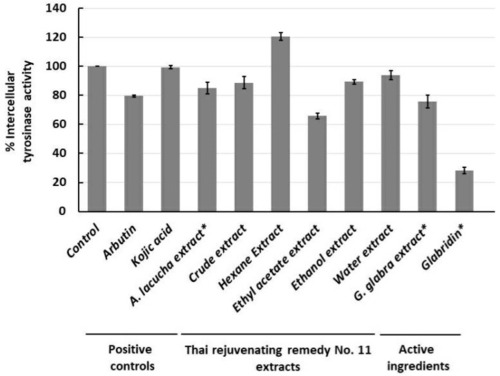
Anti-murine melanoma (B16F1) intracellular tyrosinase activity of positive controls (arbutin, kojic acid, and A. lacucha wood extract), Thai rejuvenating remedy No. 11 extracts (crude, hexane, ethyl acetate, ethanol, and water extracts), and active ingredients (G. glabra extract and glabridin) at concentrations of either 5 or 25 µg/mL. * Indicates samples tested with a concentration of 5 µg/mL. All samples are tested in triplicate (N = 3). |
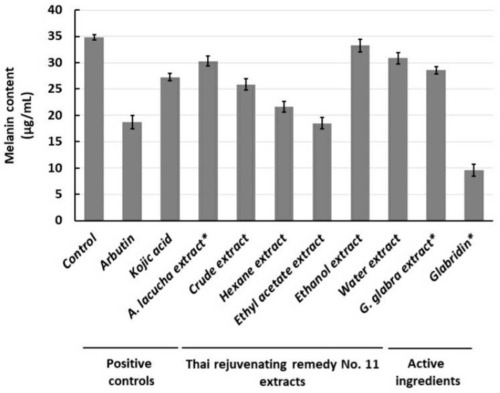
Melanin content of positive controls (arbutin, kojic acid, and A. lacucha wood extract), Thai rejuvenating remedy No. 11 extracts (crude, hexane, ethyl acetate, ethanol, and water extracts), and active ingredients (G. glabra extract and glabridin) at concentrations of either 5 or 25 µg/mL, according to sample toxicological profile. * Indicates samples tested at a concentration of 5 µg/mL. All samples are tested in triplicate (N = 3). |
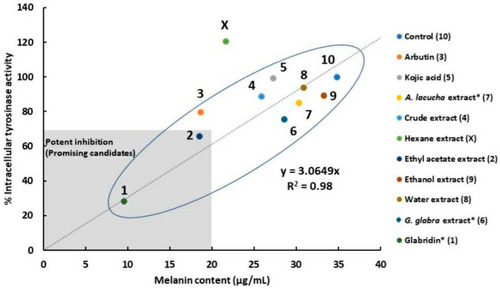
A linear relationship between% intracellular tyrosinase activity and melanin content obtained from positive controls (Arbutin, 8; Kojic acid, 5; A. lacucha extract, 7), remedy extracts (crude, 4; hexane, X; ethyl acetate, 2; ethanol, 9; water, 8), and active ingredients (G. glbra extract, 6; glabridin, 1). * Indicates samples tested at a concentration of 5 µg/mL. |
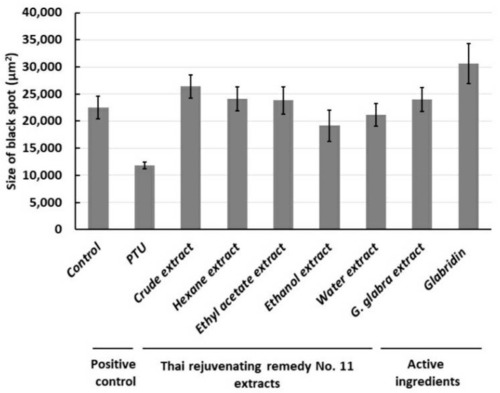
Anti-zebrafish larvae pigmentation of positive controls (1-phenyl-2-thiourea, PTU), Thai rejuvenating remedy No. 11 extracts (crude, hexane, ethyl acetate, ethanol, and water extracts), and active ingredients (G. glabra and glabridin) at a concentration of 10 µg/mL. 0.03% sea salt solution is used as a negative control. All samples are tested in triplicate (N = 3). |

Structural alignment of tyrosinases (A,B) and predicted glabridin–tyrosinase complex (C,D, closed up). (A,B) represent the structural alignment of three tyrosinases from mushroom (gray), murine (brown), and zebrafish (blue) in cartoon and surface formats. The mavConservation score is used (in A,B) to determine the degree of conservation among tyrosinases. For example, red represents a value of 1, indicating high conservation (active site). Blue represents a value of 0.333, indicating low conservation. White represents a value of 0.667, indicating medium conservation. (C,D) exhibit a predicted enzyme-inhibitor complex between glabridin and tyrosinases. Gray indicates a glabridin–mushroom tyrosinase. In comparison, brown represents a complex between glabridin–murine’s tyrosinase. Finally, blue exhibits a complex from zebrafish’s tyrosinase and glabridin. Tropolone (Black, a native competitive tyrosinase inhibitor) indicates a catalytic site on aligned tyrosinases [20]. |

Proposed molecular interplay between α-MSH (red), glabridin (green), ethyl-p-methoxycinnamate (yellow), and zebrafish MC1R (gray). (A) A side view of zebrafish MC1R presented in a ribbon form and ligands. (B) Birdseye view of zebrafish MC1R presented in a surface form and (C) a close-up view of a binding site of α-MSH (red), glabridin (green), ethyl p-methoxycinnamate (yellow) on zebrafish MC1R’s active and allosteric sites. |