
Image
|
Figure Caption
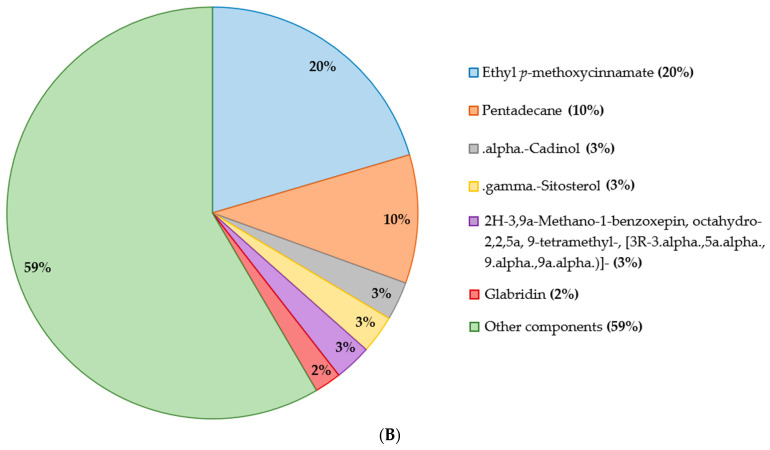
Fig. 1
Total chemical component analysis of remedy extracts, presented in a pile chart (100%) using GC–MS. (A) Metabolites present in 80% ethanol extract. (B) Metabolites present in ethyl acetate extract.
Acknowledgments
This image is the copyrighted work of the attributed author or publisher, and
ZFIN has permission only to display this image to its users.
Additional permissions should be obtained from the applicable author or publisher of the image.
Full text @ Molecules