
- Title
-
Role of Monovalent Ions in the NKCC1 Inhibition Mechanism Revealed through Molecular Simulations
- Authors
- Janoš, P., Magistrato, A.
- Source
- Full text @ Int. J. Mol. Sci.
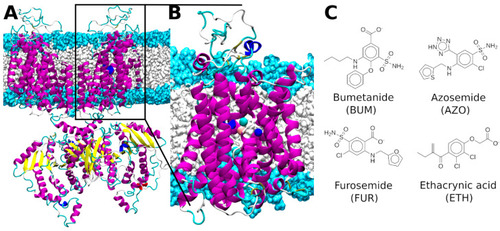
(A) Full length dimeric structure of zebrafish (z)NKCC1. (B) The monomeric transmembrane model of zNKCC1. NKCC1 is depicted as magenta, yellow, blue, cyan, and white new cartoons for α-helix, β-sheet, 310-helix, turn and coil elements, respectively. The Cl−, Na+, and K+ ions are shown as cyan, blue, and orange van der Waals spheres, respectively. The hydrophilic head groups and hydrophobic tails of the phosphatidylcholine lipids are depicted in light blue and white surfaces, respectively. (C) Sketches of the four investigated NKCC1 inhibitors. |
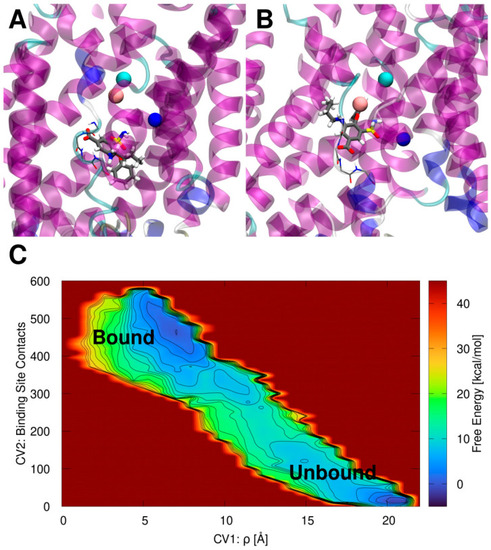
(A) Bumetanide (BUM) binding pose inside the zebrafish (z)NKCC1 structure as obtained from docking simulation. (B) BUM binding pose inside zNKCC1 as obtained from metadynamics simulation. NKCC1 is depicted as as magenta, blue, cyan, and white new cartoons for α-helix, 310-helix, turn and coil elements, respectively. The Cl−, Na+, and K+ ions are shown as cyan, blue, and orange van der Waals spheres, respectively. The BUM is shown in licorice and colored by atom name. The (empty) bCl− binding site is shown as thin licorice for visual reference. (C) Free energy surface (kcal/mol) of the BUM binding/dissociation extracted from the volume-based metadynamics simulation of the ion-bound (holo) zNKCC1. The free energy is plotted as a function of the ligand center of mass with respect to the center of mass of the protein CV1 ρ (Å) and the number of contacts of BUM with its binding site (CV2). Free energy is reported in color ranging from dark blue to dark red. Contour lines are reported every 2.0 kcal/mol. |
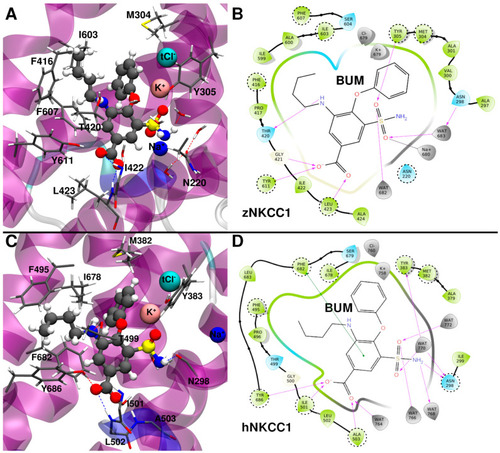
(A) Binding mode of bumetanide (BUM) to zebrafish (z)NKCC1 taken from a representative structure of the most populated cluster extracted from the molecular dynamics (MD) trajectory. (B) 2D schematic representation of the BUM/zNKCC1 interactions. (C) Binding mode of BUM to human (h)NKCC1 taken from a representative structure of the most populated cluster extracted from the MD trajectory. (D) 2D schematic representation of the BUM/hNKCC1 interactions. Polar/charged protein residues are colored blue, while the others are colored green. Waters and ions are colored gray. The most important protein residues, identified by alanine scanning analysis, are highlighted by dashed circles. |
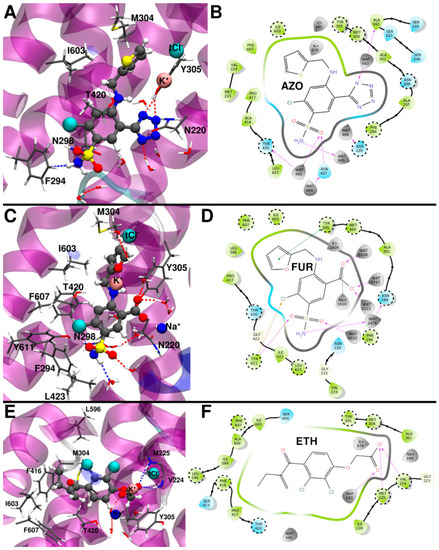
(A) Binding mode of azosemide (AZO) from the representative structure of the most populated cluster extracted from the molecular dynamics (MD) trajectory. (B) 2D schematic representation of the AZO/zNKCC1 interactions. (C) Binding mode of furosemide (FUR) from the representative structure of the most populated cluster extracted from the MD trajectory. (D) 2D schematic representation of the FUR/zNKCC1 interactions. (E) Binding mode of ethacrynic acid (ETH) from the representative structure of the most populated cluster from the MD trajectory. (F) 2D schematic representation of the ETH/zNKCC1 interactions. Polar/charged protein residues are colored blue, while the others are colored green. Waters and ions are colored gray. The most important protein residues, identified by alanine scanning analysis, are highlighted in dashed circles. |