
|
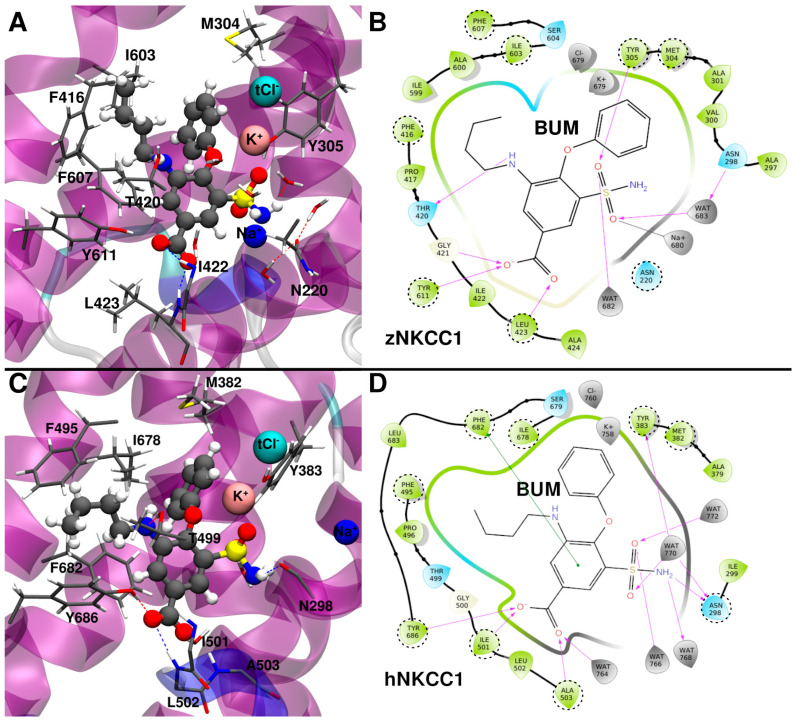
Figure 3 (A) Binding mode of bumetanide (BUM) to zebrafish (z)NKCC1 taken from a representative structure of the most populated cluster extracted from the molecular dynamics (MD) trajectory. (B) 2D schematic representation of the BUM/zNKCC1 interactions. (C) Binding mode of BUM to human (h)NKCC1 taken from a representative structure of the most populated cluster extracted from the MD trajectory. (D) 2D schematic representation of the BUM/hNKCC1 interactions. Polar/charged protein residues are colored blue, while the others are colored green. Waters and ions are colored gray. The most important protein residues, identified by alanine scanning analysis, are highlighted by dashed circles.