
|
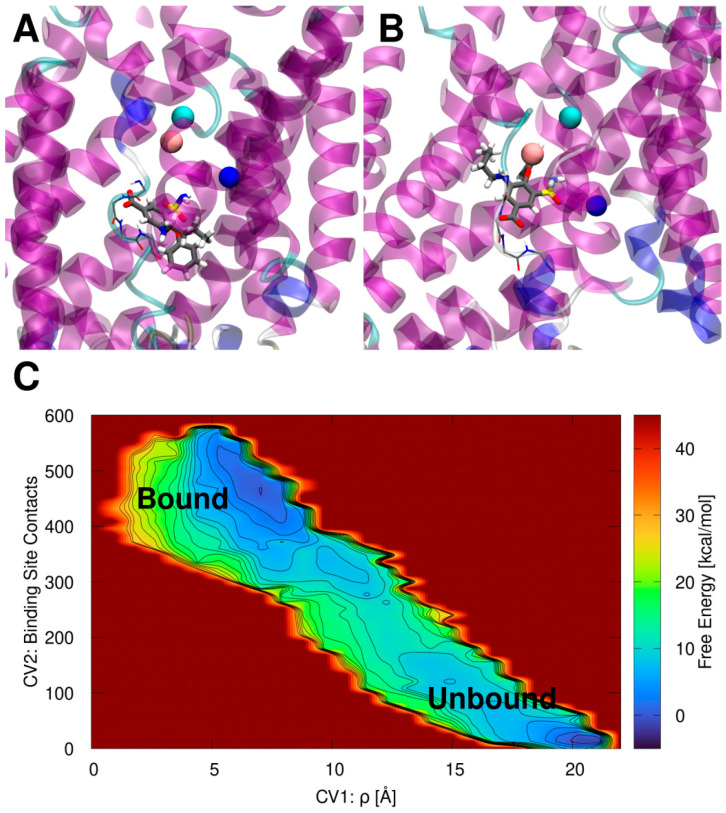
Figure 2 (A) Bumetanide (BUM) binding pose inside the zebrafish (z)NKCC1 structure as obtained from docking simulation. (B) BUM binding pose inside zNKCC1 as obtained from metadynamics simulation. NKCC1 is depicted as as magenta, blue, cyan, and white new cartoons for α-helix, 310-helix, turn and coil elements, respectively. The Cl−, Na+, and K+ ions are shown as cyan, blue, and orange van der Waals spheres, respectively. The BUM is shown in licorice and colored by atom name. The (empty) bCl− binding site is shown as thin licorice for visual reference. (C) Free energy surface (kcal/mol) of the BUM binding/dissociation extracted from the volume-based metadynamics simulation of the ion-bound (holo) zNKCC1. The free energy is plotted as a function of the ligand center of mass with respect to the center of mass of the protein CV1 ρ (Å) and the number of contacts of BUM with its binding site (CV2). Free energy is reported in color ranging from dark blue to dark red. Contour lines are reported every 2.0 kcal/mol.