
Figure 8
- ID
- ZDB-IMAGE-230122-73
- Genes
- Publication
- Shi et al., 2023 - Single-cell transcriptomic profiling of the zebrafish inner ear reveals molecularly distinct hair cell and supporting cell subtypes
- All Figures
- Figures for Shi et al., 2023
|
Figure 8
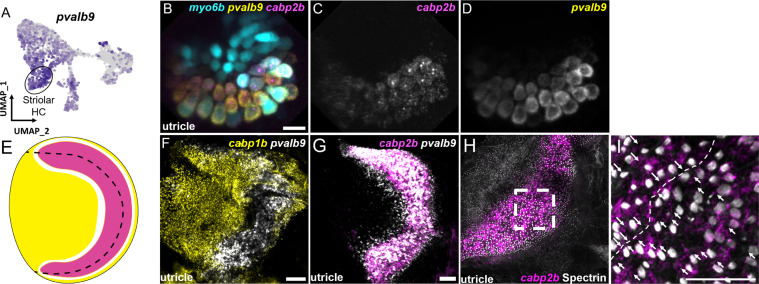
(A) Feature plot shows enrichment for the striola marker pvalb9 in cabp2b-expressing striolar cells. (B–D) HCR in situs in 5 dpf myo6b:GFP fish shows pvalb9 and cabp2b co-expression in the utricle. Scale bar = 10 μm. (E) Cartoon illustration of overlapping expression of pvalb9 (white) and cabp2b (magenta) that coincides with the line of hair cell polarity reversal. (F, G) Whole-mount RNAScope confocal images of adult zebrafish utricles showing expression of pvalb9 relative to (F) cabp1b (n=3) and (G) cabp2b (n=4). Scale bar = 25 μm. (H,I) Whole-mount RNAScope RNA and protein co-detection assay showing co-localization of cabp2b expression (RNA) and the hair cell line of polarity reversal indicated by Spectrin (protein) staining (n=3). Scale bar = 25 μm. Arrows denote hair cell polarity and dotted line outlines line of polarity reversal.
Zebrafish cabp2b+domain shares features with the mouse striolar region.