
Figure 6
- ID
- ZDB-FIG-260722-7
- Publication
- Roussange et al., 2026 - Integrative analysis of drug-gene signatures in human pluripotent stem cells reveals prazosin as a novel SQSTM1 regulator for ALS therapeutics
- Other Figures
- All Figure Page
- Back to All Figure Page
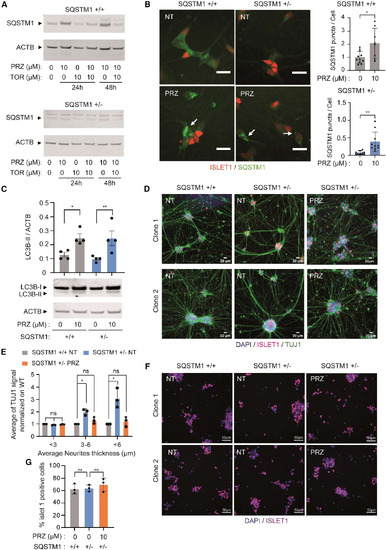
Prazosin increases SQSTM1 levels in motor neurons with SQSTM1 haploinsufficiency and normalizes neurite network defects (B) Representative images of immunocytochemistry for ISLET1 and SQSTM1 staining in MNs at 14 days of differentiation, derived from control and SQSTM1 +/− hiPSCs, either untreated (NT) or treated with 10 μM prazosin (PRZ) for 24 h. Scale bars, 10μm. Data are presented as mean ± SD from two independent differentiations from MNs progenitors derived from 2 control and 2 SQSTM1 +/− hiPSC clones (n = 4). Statistical significance was determined using Student’s t test. ∗p ≤ 0.05 and ∗∗p ≤ 0.01. (C) Representative images and quantification of LC3B-I, LC3B-II, and ACTB proteins analyzed by Western blot in MNs derived from two individual control and edited hiPSC clones, treated with 10 μM prazosin for 24 h. Data are presented as mean ± SEM from more than three independent differentiations from MN progenitors. Statistical significance was determined using one-way ANOVA with Dunnett’s post hoc test. ∗p ≤ 0.05 and ∗∗p ≤ 0.01. (D and E) Representative immunocytochemistry images (D) and quantification (E) of DAPI and TUJ1 staining in MNs at 24 days of differentiation derived from 2 SQSTM1 +/+ and 2 SQSTM1 +/− hiPSCs clones, either untreated (NT) or treated with 10 μM prazosin (PRZ) for 10 days. Scale bars, 10μm. TUJ1 staining in SQSTM1 +/+ and SQSTM1 +/− MNs was quantified and normalized to SQSTM1 +/+ MNs across three neurite thickness intervals. Data are presented as mean ± SD from three independent differentiations from MNs progenitors from 2 clones per genotype. Statistical significance was determined using the Kruskal-Wallis test with Dunnett’s post hoc multiple comparisons test. ∗p ≤ 0.05. (F and G) Representative immunocytochemistry images (F) and quantification (G) of DAPI and ISLET1 staining in MNs derived from 2 SQSTM1 +/+ and 2 SQSTM1 +/− hiPSCs clones at 18 days of differentiation, either untreated (NT) or treated with 10 μM prazosin (PRZ). Scale bars, 20 μm. Data are presented as mean ± SD from three independent differentiations from MN progenitors. Statistical significance was determined using a one-way ANOVA test. ns: not significant. |