|
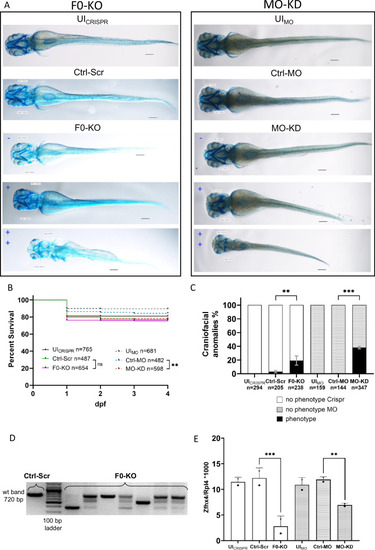
Effect of F0-generation knock-out (F0-KO) and translation-blocking morpholino knock-down (MO-KD) of zfhx4 in zebrafish larvae (zfl). A Ventral view of whole-mount Alcian blue-stained zfl at 4 dpf. For F0-KO (left) and MO-KD (right), the spectrum of the phenotypes is shown in blue (– = no phenotype, + = mild phenotype, ++ = strong phenotype). Scale bar = 113 µm. B Survival curves for each group (N = 3). Survival of F0-KO did not differ significantly from that of the Ctrl-Scr group, whereas survival was lower in MO-KD than in Ctrl-MO. Comparisons were performed using Mantel-Cox tests. Survival rates at 4 dpf: UICRISPR: 81.1%, Ctrl-Scr: 77.2%, F0-KO: 75.7%, UIMO: 89.6%, Ctrl-MO: 84.4%, MO-KD: 78.1%. C Percentages of surviving zfl at 4 dpf with craniofacial anomalies (phenotype) and no phenotype in different groups (N = 3). No distinction between phenotype severities was made. F0-KO and MO-KD injection resulted in craniofacial anomalies in 19.13% and 38.17% of zfl, respectively, compared with rates of anomalies of 3.09% in Ctrl-Scr zfl and 0% in UICRISPR/MO and Ctrl-MO zfl. Comparisons were performed using two-way analysis of variance (ANOVA) and Tukey’s multiple comparisons tests. Data are presented as means with standard error of the mean (SEM). D PCR validation of the disruption of zfhx4 exon 3 in F0-KO zfl at 4 dpf. Primer binding sites are located on adjacent introns. Expected wt band size, 720 bp. E Liquid chromatography mass spectrometry (LC-MS) analysis of protein lysates from heads of 3 dpf zfl (N = 2). Depicted are Zfhx4 fold changes relative to the 60S ribosomal protein L4 (Rpl4) abundance in each sample. Zfhx4 levels were decreased by 77.1% in F0-KO compared with levels in Ctrl-Scr and by 41.6% in MO-KD compared with levels in Ctrl-MO. Individual data for LC-MS run1 (stars) and run2 (dots) are plotted. Comparisons were performed using two-way analysis of variance (ANOVA) and Tukey’s multiple comparisons tests. Data are presented as means with standard deviation (SD). ns, p > 0.05, **p ≤ 0.01, ***p ≤ 0.001; dpf days post-fertilization, UICRISPR/MO uninjected wild-type zfl, Ctrl-MO Control MO-injected zfl, Ctrl-Scr Scrambled control-injected zfl, wt wild-type.
|