
Fig. 1
- ID
- ZDB-FIG-250430-173
- Publication
- Espigares et al., 2025 - Optimistic and pessimistic cognitive judgement bias modulates the stress response and cancer progression in zebrafish
- Other Figures
- All Figure Page
- Back to All Figure Page
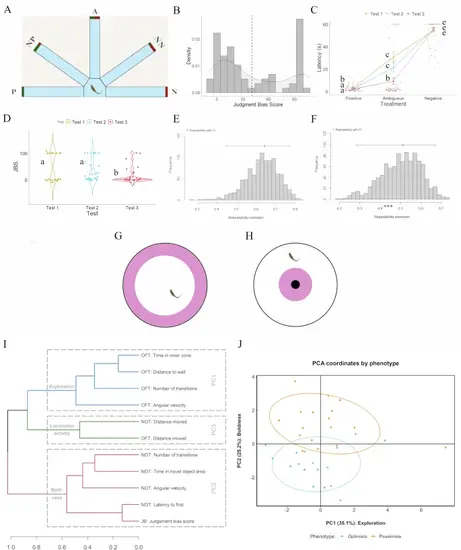
Behavioral characterization of judgement bias in zebrafish.Behavioral characterization of judgment bias in male zebrafish considering the upper and lower quartiles of the Judgment Bias Score (JBS; n = 34). A Diagram of the half radial maze showing the two reference (positive/rewarded (P) and negative/aversive (N)) and the ambiguous (A) locations that were used in the judgment bias test (JBT) for zebrafish; B JBS-frequency distribution of the fish that learned the judgment bias task (n = 73); C Performance of male WT zebrafish in the judgment bias paradigm with repeated testing. Different letters indicate significant differences between the experimental groups (Test 1, Test 2, and Test 3) for each Treatment (P, N, A) following planned comparisons tests. Data are expressed as mean ± s.e.m.; D JBS of male WT zebrafish with repeated testing. Different letters indicate significant differences between experimental groups (Test 1, Test 2, and Test 3) following planned comparisons tests. Data are expressed as mean ± s.e.m.; E Bootstrap repeatabilities for the latency to enter the ambiguous arm of the behavioral apparatus; F Bootstrap repeatabilities for the JBS. G Diagram of the Open Field Test (OFT); H Diagram of the Novel Object Test (NOT); I Degrees of correlation (r) between the different behavioral metrics, illustrated in the cladogram as degrees of association; J First two components of a Principal Component Analysis (PCA) on all metrics derived from the judgment bias, open field and novel object behavioral tests (JBT, OFT and NOT, respectively), comparing between optimistic and pessimistic fish in a behavioral parameter space. The first two dimensions explain 35.1 and 25.2% of the variance, respectively. |