
- Title
-
Optimistic and pessimistic cognitive judgement bias modulates the stress response and cancer progression in zebrafish
- Authors
- Espigares, F., Alvarado, M.V., Abad-Tortosa, D., Varela, S.A.M., Sobral, D., Faísca, P., Paixão, T., Oliveira, R.F.
- Source
- Full text @ Transl Psychiatry
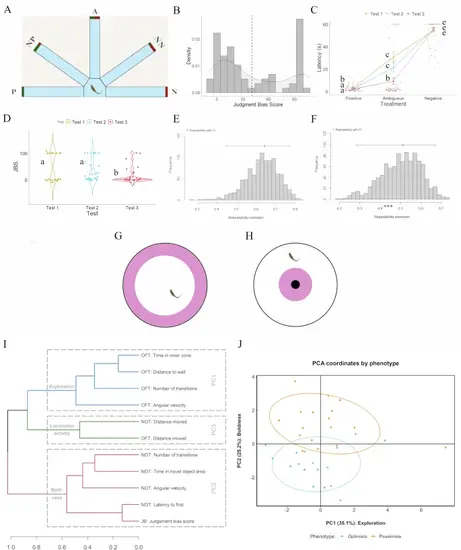
Behavioral characterization of judgement bias in zebrafish.Behavioral characterization of judgment bias in male zebrafish considering the upper and lower quartiles of the Judgment Bias Score (JBS; n = 34). A Diagram of the half radial maze showing the two reference (positive/rewarded (P) and negative/aversive (N)) and the ambiguous (A) locations that were used in the judgment bias test (JBT) for zebrafish; B JBS-frequency distribution of the fish that learned the judgment bias task (n = 73); C Performance of male WT zebrafish in the judgment bias paradigm with repeated testing. Different letters indicate significant differences between the experimental groups (Test 1, Test 2, and Test 3) for each Treatment (P, N, A) following planned comparisons tests. Data are expressed as mean ± s.e.m.; D JBS of male WT zebrafish with repeated testing. Different letters indicate significant differences between experimental groups (Test 1, Test 2, and Test 3) following planned comparisons tests. Data are expressed as mean ± s.e.m.; E Bootstrap repeatabilities for the latency to enter the ambiguous arm of the behavioral apparatus; F Bootstrap repeatabilities for the JBS. G Diagram of the Open Field Test (OFT); H Diagram of the Novel Object Test (NOT); I Degrees of correlation (r) between the different behavioral metrics, illustrated in the cladogram as degrees of association; J First two components of a Principal Component Analysis (PCA) on all metrics derived from the judgment bias, open field and novel object behavioral tests (JBT, OFT and NOT, respectively), comparing between optimistic and pessimistic fish in a behavioral parameter space. The first two dimensions explain 35.1 and 25.2% of the variance, respectively. |
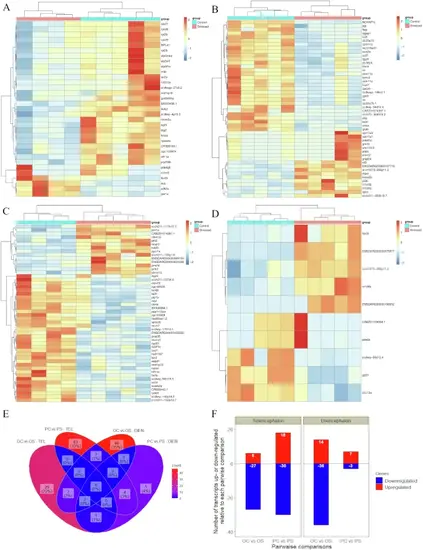
Chronic stress-driven changes in the brain of optimistic and pessimistic zebrafish.Chronic stress-driven changes in gene expression in the brain of judgment bias-related phenotypes (n = 5 per experimental group: optimists control, pessimists control, optimists stress, and pessimists stress). A Hierarchical clustering of optimistic individuals from each treatment (control versus stress; columns) and of DEG (lines) in the telencephalon; B Hierarchical clustering of pessimistic individuals from each treatment (control versus stress; columns) and of DEG (lines) in the telencephalon; C Hierarchical clustering of optimistic individuals from each treatment (control versus stress; columns) and of DEG (lines) in the diencephalon; D Hierarchical clustering of pessimistic individuals from each treatment (control versus stress; columns) and of DEG (lines) in the diencephalon. Heatmaps represent normalized gene expression levels (red, high expression; blue, low expression); E Venn diagram showing the number of DEG shared between each control group and their stressed counterparts (control versus stress) in the telencephalon and diencephalon; F Total number of DEG up- and down-regulated relative to each control group and their stressed counterparts (control versus stress) in the telencephalon and diencephalon. |
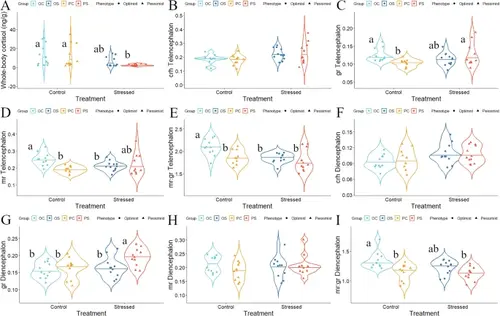
Differential levels of HPI axis-related factors between optimistic and pessimistic zebrafish.Differential levels of a comprehensive set of factors associated with the HPI axis between judgment bias-related phenotypes exposed to the effects of chronic stress (n = 12 per experimental group: optimists control, pessimists control, optimists stress, and pessimists stress). A Cortisol; B crh expression in the telencephalon; C gr expression in the telencephalon; D mr expression in the telencephalon; E mr/gr ratio in the telencephalon; F crh expression in the diencephalon; G gr expression in the diencephalon; H mr expression in the diencephalon; I mr/gr ratio in the diencephalon. Different letters indicate significant differences between the experimental groups following planned comparisons tests. Data are expressed as mean ± s.e.m. |
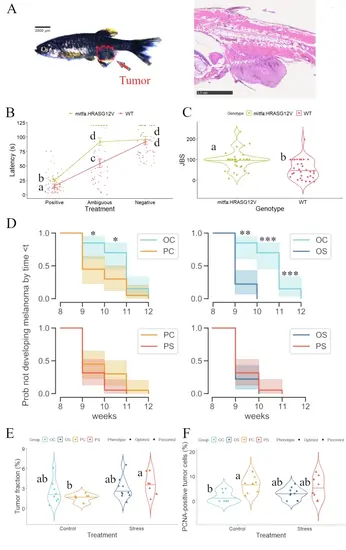
Differences in onset and progression of melanoma tumor between optimistic and pessimistic zebrafish.Differences in onset and progression of melanoma tumor between judgment bias-related phenotypes exposed to the effects of chronic stress (n = 7–11 per experimental group: optimists control, pessimists control, optimists stress, and pessimists stress). A Representative image of juvenile transgenic zebrafish harboring melanoma tumor and its corresponding histological section; B Performance of juvenile melanoma zebrafish and their WT siblings in the judgment bias paradigm (n = 32 each group). Different letters indicate significant differences between the experimental groups (transgenic fish and WT) for each Treatment (P, N, A) following planned comparisons tests. Data are expressed as mean ± s.e.m.; C JBS of juvenile melanoma zebrafish and their WT siblings. Different letters indicate significant differences between experimental groups (transgenic fish and WT); D Melanoma occurrence over time in juvenile transgenic fish (OC optimists control; PC pessimists control; OS optimists stress; PC pessimists stress). Asterisks indicate statistically significant differences between the experimental groups at each sampling point: *p < 0.05, **p < 0.01, ***p < 0.001; E Tumor fraction (%) in the different experimental groups of juvenile melanoma fish. Different letters indicate significant differences between the experimental groups following planned comparisons tests. F PCNA-positive tumor cells (%) in the different experimental groups of juvenile melanoma fish. Different letters indicate significant differences between the experimental groups following planned comparisons tests. |