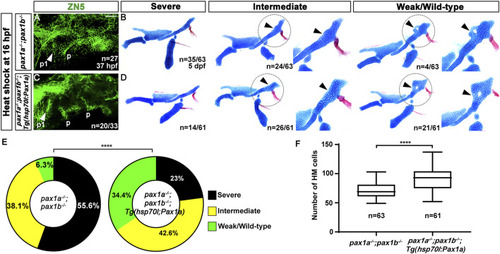
Rescue of the defects in the first pouch and hyomandibular cartilage in pax1 double mutants with an enforced expression of pax1a at 16 hpf. (A, C) Zn5 staining labels to visualize pouches at 37 hpf. The first pouches are marked with arrowheads. After the heat-shock treatment at 16 hpf for 40 min, while only two pouches (p1 and p) with abnormal shapes are seen in pax1 double mutants (A), the first pouch (p1) is pretty normal, with other pouches disorganized, in pax1 double mutants carrying Tg(hsp70I:Pax1a) transgene (C). p, pouch. Scale bar = 40 μM. (B, D) Unilateral dissections of the skeletons of the mandibular and hyoid arches stained with Alcian Blue (cartilage) and Alizarin Red (bone) at 5 dpf, along with inserts showing the zoomed-in HM plate (circled areas). (B) After the heat shock treatment in pax1 double mutants, a rod-shape HM is seen in the severe group, more cells appear in the rod-shape HM in the intermediate group compared to the severe group, and the foramen is seen, with adjacent mono-layered cells in the weak group. Arrowheads indicate the cells appearing in the HM plate in the intermediate group and the mono-layered cells adjacent to the foramen in the weak group. No wild-type HM plate is observed. (D) After the heat shock treatment in pax1 double mutants bearing Tg(hsp70I:Pax1a) transgene, HM defects in all three groups were observed, but with a different frequency than those observed in (B); wild-type HM plates are also observed. Arrowheads indicate the cells appearing in the HM plate in the intermediate group and the multi-layered cells adjacent to the foramen in the wild-type HM plate. (E) Quantification of the frequency of each group between (B, D). The frequency of each group is counted. Data is represented on a pie chart. Black, yellow, and green represent the severe, intermediate, and weak/wild-type groups, respectively. **** indicates p < 0.0001. (F) Quantification of HM defects. The number of cells in HM is counted. Data is represented on a boxplot. **** indicates p < 0.0001. n, number of animals analyzed.
|
