|
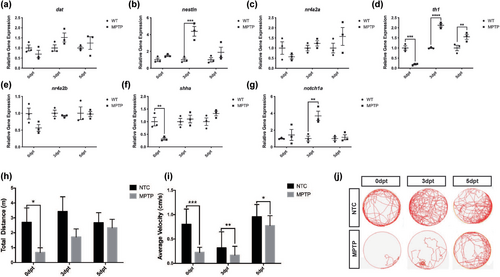
nr4a2 response following MPTP-induced neurodegeneration. (a–g) Relative gene expression is also provided for markers of regeneration, neurogenesis, DAnergic transcription, and synthesis throughout recovery in larvae (n = 3 pools of 7 larvae). One-way ANOVA: DF: Within group = 12, between groups =2. a: F = 0.9196, p = 0.3565. b: F = 26.39, p = 0.0002; c: F = 0.3415, p = 0.5698; d: F = 14.24, p = 0.0027; e: F = 3.335, p = 0.0928; f: F = 0.6289, p = 0.4432 g: F = 11.24, p = 0.0057. (h–i) Total distance traveled and average velocity of MPTP-treated and NTC control from 0- to 5dpt (n = 30). Multiple paired t tests. h: DF, 31,53, 80; t value: 2.5722; 1.6243; 0.3756, p: 0.01512; 0.1103; 0.7082; I: DF: 31, 53, 66, t values: 7.9286; 2.1412; 3.2482; p ≤ 0.000001; 0.0369; 0.0018. (j) Representative path images. Bars represent the Mean ± the SEM. **p < 0.01, ***p < 0.001, ****p < 0.0001.
|