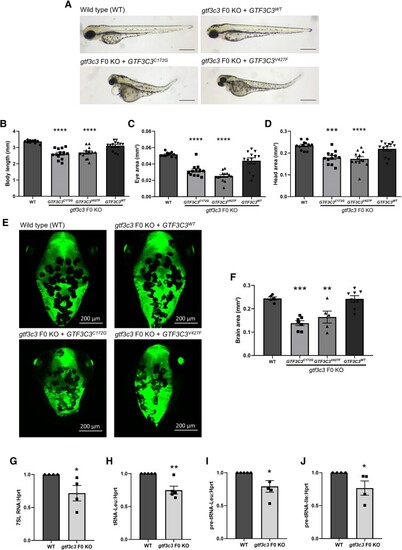
Effect of GTF3C3 mutations on POLR3 target gene expression. (A) Morphology of zebrafish WT, gtf3c3 F0 KO + GTF3C3WT, gtf3c3 F0 KO+GTF3C3C172G and gtf3c3 F0 KO + GTF3C3V427F larvae at 3 dpf. Scale bars: 500 µm. Body length (B), eye size (C) and head size (D) of WT, gtf3c3 F0 KO + GTF3C3WT, gtf3c3 F0 KO + GTF3C3C172G and gtf3c3 F0 KO + GTF3C3V427F at 3 dpf (n = 12–13). (E) Dorsal view of GFAP 3 dpf larvae WT, gtf3c3 F0 KO + GTF3C3WT, gtf3c3 F0 KO + GTF3C3C172G and gtf3c3 F0 KO + GTF3C3V427F. Scale bars: 200 µm. (F) Head area of GFAP 3 dpf larvae WT, gtf3c3 F0 KO + GTF3C3WT, gtf3c3 F0 KO + GTF3C3C172G and gtf3c3 F0 KO + GTF3C3V427F(n = 12–13). (G–J) Quantitative real-time PCR. (G) 7SL RNA, (H) tRNAleu, (I) pre-tRNAleu and (J) pre-tRNAile expression relative to the expression of the Pol II target gene hrpt, in pooled 3 dpf (n = 20 for each pool) gtf3c3 F0 KO compared to pooled WT larvae (N = 4–5). All data are represented as the mean ± SEM. Statistical significance was calculated by Mann–Whitney test, or Dunnett's multiple comparisons tests. *P < 0.05, **P < 0.01; #P < 0.005, ***P < 0.001; ****P < 0.0001; ns, not significant. n represents number of fish, N represents number of experimental repeats.
|
