
Figure 4
- ID
- ZDB-IMAGE-250306-8
- Publication
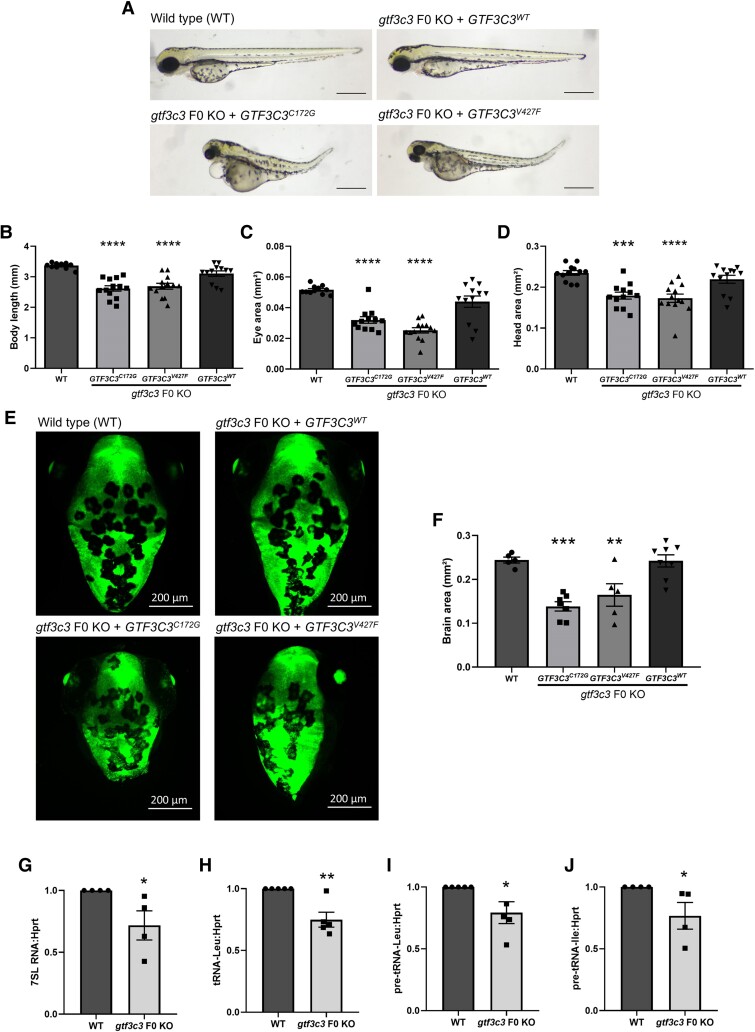
- Abdel-Hamid et al., 2025 - Biallelic variants in GTF3C3 encoding a subunit of the TFIIIC2 complex are associated with neurodevelopmental phenotypes in humans and zebrafish
- All Figures
- Figures for Abdel-Hamid et al., 2025
|
Figure 4