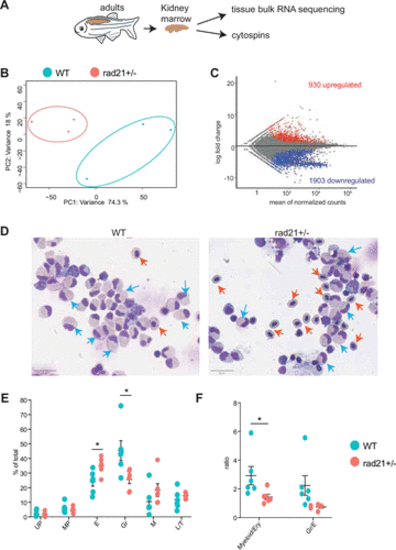
WKM of rad21+/− zebrafish show transcriptional dysregulation and altered erythroid and granulocytic outputs. A: schematic of experimental process. B: principal component analyses of the WT and rad21+/− WKM bulk RNA sequencing. C: WKM bulk RNA sequencing- MA plot showing DEGs identified in the comparison of rad21+/− versus WT. Red and blue denote significant (adjusted P ≤ 0.05) DEGs in rad21+/− compared with WT. D: representative MayGrunwald/Giemsa staining of WKM cytospins. Blue arrows denote examples of maturing granulocytes and orange arrows denote examples of orthochromatic erythroid cells. E: the percentage of different hematopoietic cells identified in the WKM cytospins. F: ratio of myeloid (includes maturing granulocytes, myeloid precursors, and monocytes/macrophages) or maturing granulocytic cells relative to erythroid cells in the WKM. Data in E and F were obtained by counting 1,000–2,000 cells in WKM cytospins prepared from each zebrafish. Error bars represent means ± SE (n = 6 per genotype). Significance in E and F was determined using Student’s t test. *P < 0.05. E, erythroid cells (includes basophilic, polychromatic, and orthochromatic erythroid); Gr, maturing granulocytic cells (include promyelocytes, myelocytes, metamyelocytes, bands, segmented forms, and eosinophils/basophils); L, lymphoid; M, monocytes/macrophages; MP, myeloid precursors (granulocytic or monocytic); T, thrombocytes; UP, undifferentiated precursors; WKM, whole kidney marrow; WT, wild type.
|

