
Fig.1
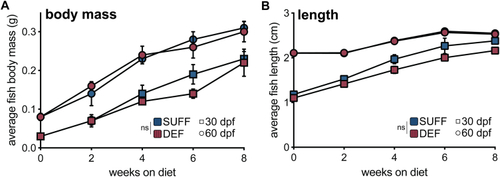
Wild-type zebrafish fed a DHA-deficient diet have similar growth trajectories as fish fed DHA-sufficient diet. A: Average fish body mass, calculated by dividing total tank wet mass by the number of fish per tank. B: Average fish length (nose to caudal peduncle), calibrated to ruler in tank. Separate cohorts of fish were fed the assigned diets starting at either 30 or 60 dpf, indicated in the plots by square or circle symbols, respectively. The main effects of diet and time (weeks on diet) were analyzed by 2-way repeated measures ANOVAs for the 30 and 60 dpf cohorts separately. Body mass and length did not differ between the SUFF and DEF groups for either initiation age. As expected for developing zebrafish, body mass and length significantly increased with feeding duration (body mass: 30 dpf, |
| Fish: | |
|---|---|
| Condition: | |
| Observed In: | |
| Stage Range: | Days 30-44 to Adult |