|
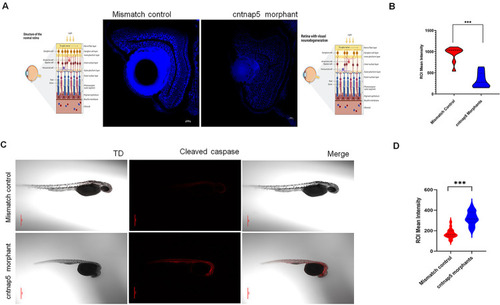
A. Representative eye tissue images of Nissl granules expression of zebrafish embryos (96 hpf) injected with a mismatch control (left) and cntnap5 morpholino (right). Corresponding cartoons are created using BioRender.com licensed version. B. Comparative analysis of eye mean intensity of eye for both groups. bars = mean ± SE, ns not significant, ***p < 0.005. C. Representative whole mount confocal images of cleaved expression of zebrafish embryos (32 hpf) injected with cntnap5 morpholino (upper) or mismatch control (lower) D. Comparative analysis of mean intensity of eye for the both groups, bars = mean ± SE, ns not significant, ***p < 0.005.
|