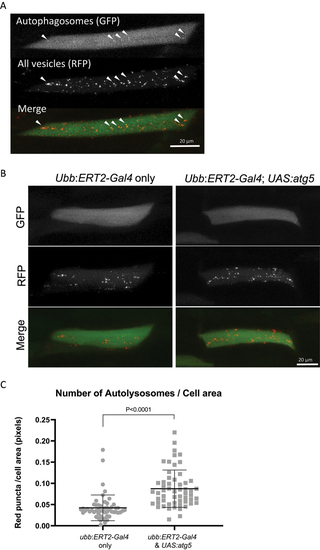
Expression of Atg5 increases autophagic flux in muscle cells. Eggs from a ubb:ERT2-Gal4 x UAS:atg5 cross were injected with the UAS:mRFP-GFP-lc3 reporter and treated with 1 µM tamoxifen from 8 h.p.f. The numbers of autophagosomes and autolysosomes were quantified in individual muscle cells of larvae at 96 h.p.f. (a) Representative images of a muscle cell expressing mRFP-GFP-lc3, a dual-fluorescent reporter for the quantification of autophagic flux. Autophagosomes are visualized as bright puncta evident in both green and red channels (white arrowheads). Red puncta without any green signal correspond to autolysosomes, since the GFP signal has been quenched by the low pH following lysosome fusion. Very few autophagosomes (yellow puncta) are observed compared to autolysosomes (red only puncta) with this reporter construct suggesting autophagosomes rapidly fuse with the lysosome. Images shown are the maximum intensity projections of the green and red channel z-stacks. Scale bar: 20 μm. (b) Representative images of muscle cells expressing mRFP-GFP-lc3 in larvae overexpressing Atg5 and their corresponding non-expressing siblings from a cross of ubb:ERT2-Gal4 x UAS:atg5 fish. Red vesicles (autolysosomes) were more abundant in Atg5-expressing larvae. Few cells were found with yellow vesicles (autophagosomes) in either experimental group. Scale bar: 20 μm. (c) Quantification of autolysosomes per cell area calculated from maximum intensity projection of the red channel of individual muscle cells. Overexpression of Atg5 resulted in a statistically significant increase in autolysosomes. Graph represents the numbers of red puncta normalized to the area of the cell (in pixels) (N = 53 control muscle cells; N = 57 atg5-expressing muscle cells; P < 0.0001).
|
