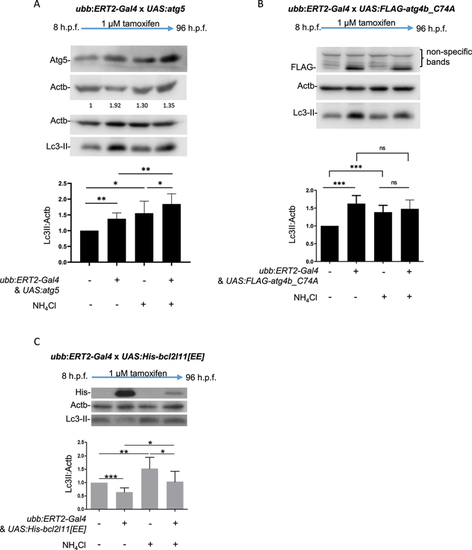
Regulation of transgene expression using ERT2-Gal4 and UAS transgenic lines to control autophagic flux. (a) Induction of Atg5 expression results in upregulation of autophagy. All larvae from crosses of ubb:ERT2-Gal4 and UAS:atg5 were treated with 1 µM tamoxifen from 8 h.p.f. to 96 h.p.f. Endogenous Atg5 expression is detected in larvae which do not carry the transgenes. A significant increase in expression of Atg5 is observed in double transgenic larvae (resulting from UAS-transgene expression) and this correlates with increased Lc3-II. NH4Cl treatment is used to block lysosome acidification and therefore block autophagic flux. The increase in Lc3-II observed in Atg5 expressing larvae with NH4Cl treatment reflects the accumulation of autophagosomes which cannot be degraded. (b) Induction of Atg4bC74A expression results in a block in autophagic flux. All larvae from crosses of ubb:ERT2-Gal4 and UAS:FLAG-atg4b_C74A were treated with 1 µM tamoxifen from 8 h.p.f. to 96 h.p.f. Expression of the FLAG-tagged Atg4bC74A transgene is observed in double transgenic larvae and this correlates with an increase Lc3-II. Lc3-II levels do not increase further in NH4Cl treatment conditions indicating that Atg4bC74A expression causes a block in autophagic flux. Nonspecific bands were observed above the FLAG band in all treatment groups and genotypes. (c) Induction of Bcl2l11[EE] expression results in a downregulation of autophagy. All larvae from crosses of ubb:ERT2-Gal4 and UAS:His-bcl2l11[EE] were treated with 1 µM tamoxifen from 8 h.p.f. to 96 h.p.f. Expression of His-tagged Bcl2l11[EE] is observed in double transgenic larvae and this correlates with a decrease in Lc3-II. Lc3-II levels increase in NH4Cl treatment conditions in both non-expressing and Bcl2l11[EE] expressing larvae as autophagosomes cannot be degraded. However, in Bcl2l11[EE] expressing larvae, Lc3-II levels remain significantly lower than non-transgenic siblings indicating a downregulation in autophagy. In all panels, graphs show mean values (± SEM) of densitometry of Lc3-II normalized to Actb (loading control) from >3 independent experiments. All graphs are normalized to the control (no transgene; no NH4Cl treatment) condition. Statistical analysis was performed using paired t-tests; ns – not significant; *p < 0.05; **p < 0.01; ***p < 0.001.
|
