|
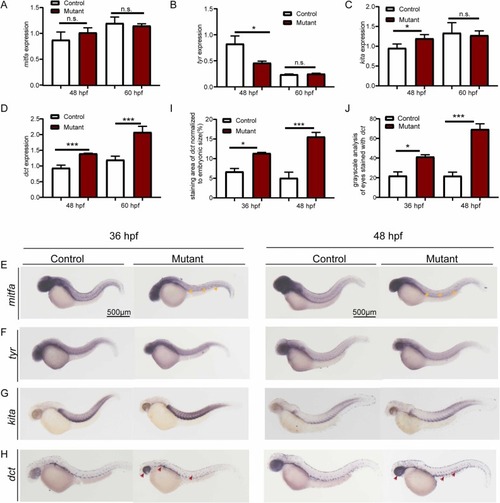
The expression of melanocyte markers detected in sibling controls and mutant embryos. A-D, The relative expression levels of melanocyte marker genes in control and mutant embryos detected by qPCR. E-H, The expression pattern of melanocyte marker genes in control and mutant embryos detected by in situ hybridization. Note the disorganized expression of mitfa (yellow arrows) and increased expression of dct (red arrows) in the mutants. I, The relative staining area normalized to the embryonic size detected by the dct probe in the skin of control and mutant embryos. J, Quantitative analysis based on grayscale measurement of the pigments in eyes detected by the dct probe. *p < 0.05, ***p < 0.001 and n.s., not significant. (For interpretation of the references to colour in this figure legend, the reader is referred to the web version of this article.)
|