
Fig. 4; supplement 1
- ID
- ZDB-FIG-220607-45
- Publication
- Sánchez-Iranzo et al., 2022 - Strength of interactions in the Notch gene regulatory network determines patterning and fate in the notochord
- Other Figures
- All Figure Page
- Back to All Figure Page
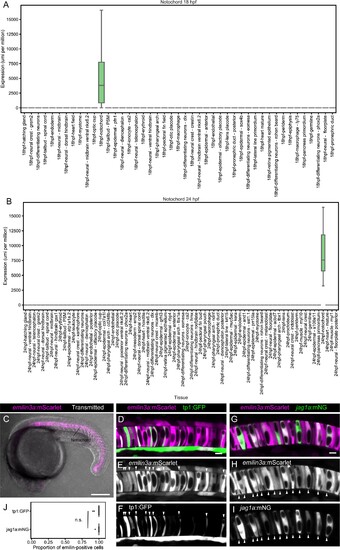
(A and B) Boxplot representing emilin3a expression in different tissues at 18 (A) and 24 hpf (B) according to single-cell transcriptomics. (C) Maximum projection of optical confocal sections of an emilin3a:mScarlet transgenic line at 21 hpf. Transmitted light is shown in gray scale. (D – I) Airyscan confocal optical sections of 21 hpf double transgenic emilin3a:mScarlet/tp1:GFP (D–F) or emilin3a:mScarlet/jag1a:mNeonGreen. Although at different intensities, emilin3a expression can be detected in most of the cells. Arrowheads point to the tp1:GFP- and jag1a:mNG-positive cells to facilitate their identification in the emilin3a:mScarlet channel. (J) 98% ± 3% of the tp1:GFP 99% ± 2% of the jag1a:mNeonGreen cells are emilin3a:mScarlet positive. Cells with an emilin3a:mScarlet signal that is more intense than the background were considered emilin3a:mScarlet-positive. Each dot represents an individual fish (n = 10 tp1:GFP, n = 6 jag1a:mNG). (n. s.) non-significant (0.67) differences by two-tailed t-test. Scale bars, 200 μm (C), 10 μm (D, G). |