Fig. 1: supplement
- ID
- ZDB-FIG-220607-38
- Publication
- Sánchez-Iranzo et al., 2022 - Strength of interactions in the Notch gene regulatory network determines patterning and fate in the notochord
- Other Figures
- All Figure Page
- Back to All Figure Page
|
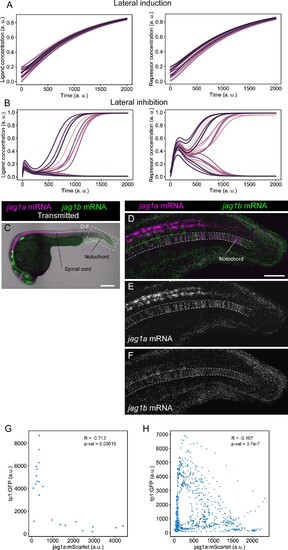
(A and B) Representative simulations of NICD and Ligand molecules in each cell for the lateral induction (A) and lateral inhibition (B) models. Each line represents a different cell. Related to models and simulations shown in Figure 1E and F. (C) Confocal projections of 24-hpf zebrafish stained with in situ HCR probes against jag1a (magenta) and jag1b (green). (D–F) Airyscan confocal projections at a higher magnification of boxed region in (C). n = 5 fish. (G) jag1a:mScarlet and tp1:GFP expression levels of each individual cell. Shown values are the mean intensity in a manually selected region of the cytoplasm of each independent cell on a single plane of the image shown in Figure 1J. Cells that are not labeled with jag1a:mScarlet or tp1:GFP cannot be distinguished, and were not included in the analysis. (H) Scatter plot of the intensities shown in Figure 1M. Pearson correlation and p-value of the correlation is shown in the plot. Scale bars, 200 μm (C) and 50 μm (D). |

