
Figure 6
- ID
- ZDB-FIG-211219-59
- Publication
- Bartel et al., 2021 - Spectral inference reveals principal cone-integration rules of the zebrafish inner retina
- Other Figures
- All Figure Page
- Back to All Figure Page
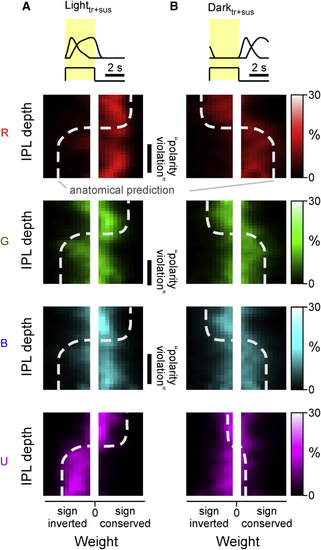
Cone-weight distribution across the inner plexiform layer Two-dimensional histograms of weights (x axes) associated with each cone resolved by IPL position (y axes). Brighter colors denote increased abundance. For simplicity, the weights associated with the light (Ltr and Lsus) and dark components (Dtr and Dsus), are combined in (A) and (B), respectively. Moreover, near-zero weights are not shown (central white bar in all panels). The thick white dotted lines indicate approximate expected distribution of weights based on traditional “On-Off” lamination of the inner retina. By each panel’s side, instances where this expectation is violated are highlighted as “polarity violation.” |