
Figure 5
- ID
- ZDB-FIG-211219-58
- Publication
- Bartel et al., 2021 - Spectral inference reveals principal cone-integration rules of the zebrafish inner retina
- Other Figures
- All Figure Page
- Back to All Figure Page
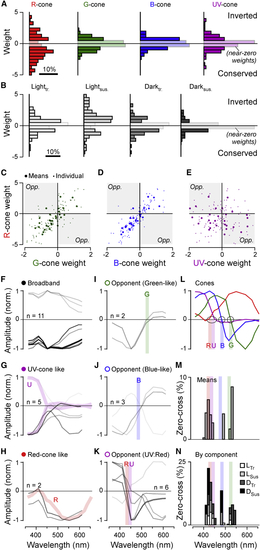
Major trends in cone weights and spectral tunings (A and B) Histograms of all weights associated with inputs to each of the four cones across all clusters, independent of temporal-component types (A) and, correspondingly, histograms of all weights associated with temporal components, independent of cone type (B). Near-zero weights (abs(w) < 0.5) are graphically de-emphasized for clarity. All weights contributed equally to these histograms, independent of the size of their corresponding cluster. (C–E) Scatterplots of all clusters’ weights associated with each cone plotted against each other as indicated. Large symbols denote the mean weight associated with each cone and cluster across all four temporal components (i.e., one symbol per cluster), while small symbols denote each weight individually (i.e., four symbols per cluster, corresponding to Ltr, Lsus, Dtr, and Dsus). The remaining three possible cone correspondences (G:B, G:U, and B:U) are shown in (F–K) Peak-normalized “bulk” spectral tuning functions of all 29 clusters, grouped into six categories as indicated. The strength of each line indicates the numerical abundance of ROIs belonging to each cluster (darker shading = larger number of ROIs; exact number of ROIs contributing to each cluster are listed in (L) Cones’ spectral tuning functions, with approximate zero crossings (blue and green cones) and zero positions (red and UV cones) graphically indicated. (M and N) Histograms of zero crossings across all BC clusters, incorporating the abundance of ROIs belonging to each cluster. Shown are crossings of bulk spectral tunings functions (M; cf. F–H) and of spectral tuning functions that were computed for each temporal component individually, as indicated (see also |