|
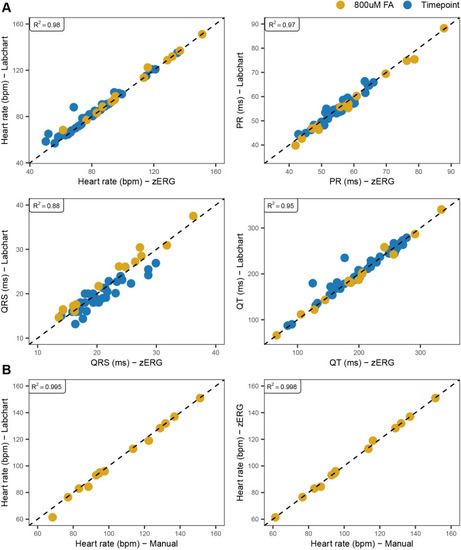
Comparison of ECG metrics between zERG and LabChart. Measurements from a total of 55 traces from two independent experiments, either from 0.800 mmol/l FA drug studies (n=14; referred to as FA) or from recording sessions in which 41 traces were captured from 11 AB fish over multiple timepoints (referred to as Timepoint), were used for comparison of zERG and LabChart performance. (A) Metrics obtained from zERG are nearly identical to those obtained from LabChart. (B) Comparison of heart rate between LabChart, zERG and a manual calculation. zERG heart rate calculations are nearly identical to those obtained from a manual calculation. bpm, beats/min.
|