FIGURE SUMMARY
Title

Development and optimization of an in vivo electrocardiogram recording method and analysis program for adult zebrafish

Authors
Duong, T., Rose, R., Blazeski, A., Fine, N., Woods, C.E., Thole, J.F., Sotoodehnia, N., Soliman, E.Z., Tung, L., McCallion, A.S., Arking, D.E.
Source
Full text @ Dis. Model. Mech.

Adult zebrafish ECG recording apparatus and protocol. (A) Comparison of human and zebrafish ECG. Top: ECG of a healthy 32-year-old human male, obtained from the MIT-BIH Normal Sinus Rhythm Database (Goldberger et al., 2000). Bottom: ECG from a 6-month-old adult male AB zebrafish, captured using the described recording apparatus and protocol. All cycles within the 60 s (human) and 120 s (zebrafish) recordings were overlaid (green traces), and an average trace was calculated (black trace) using the LabChart ‘ECG Analysis’ module. Traces are shown on the same time scale for direct comparison. (B) Adult zebrafish ECG apparatus; during recordings, the zebrafish is placed ventral side up within the mold located in a well on the base. For ease of reference, apparatus components and axes used to describe the movement of the components are labeled. (C) Summary of adult zebrafish ECG recording protocol. (D) Example from a 6-month-old adult male AB zebrafish using the described recording apparatus and protocol. The trace image was captured using LabChart ‘Zoom View’.

Overview of zebrafish ECG reading GUI (zERG), a zebrafish ECG analysis software program. In step 1, ECG voltage measurements are imported into zERG. In step 2, data for peak analysis are selected. During peak analysis, P waves (red asterisks) and QRS complexes (black asterisks) are identified based on the following: (1) the user-defined wave amplitude threshold; (2) the minimum peak distance; and (3) classification based on the distance between the P peak to R wave of consecutive cycles and the reference distance defined as two times the first ‘P peak to R wave’ interval. Consecutive red or black peaks are marked yellow for error correction; the user can then manually add and/or delete P waves and/or QRS complexes. Once all waves are marked correctly, the user can proceed to step 3 by choosing the ‘Calculate Average Trace’ button. This plots an average trace and allows the user to click on ‘Add Markers’ to note wave markers on the average trace. Finally, after all peaks are confirmed, the user selects ‘Analyze ECGs’ to obtain a graphical user interface (GUI) table with the ECG metrics, in addition to an output .txt and several average trace plots. The yellow boxes show an example of a trace in which the P wave amplitude exceeds the R wave amplitude and how zERG handles such traces. The example trace in the blue boxes was captured from a 6-month-old AB wild-type male fish, and the trace in the yellow boxes was captured from a 3.5-month-old AB wild-type male fish after being dosed with 0.800 mmol/l FA for 15 min. All images were captured from zERG version 1.0.

Comparison of ECG metrics between zERG and LabChart. Measurements from a total of 55 traces from two independent experiments, either from 0.800 mmol/l FA drug studies (n=14; referred to as FA) or from recording sessions in which 41 traces were captured from 11 AB fish over multiple timepoints (referred to as Timepoint), were used for comparison of zERG and LabChart performance. (A) Metrics obtained from zERG are nearly identical to those obtained from LabChart. (B) Comparison of heart rate between LabChart, zERG and a manual calculation. zERG heart rate calculations are nearly identical to those obtained from a manual calculation. bpm, beats/min.

Correlation of zebrafish ECG traits and covariates. Zebrafish ECG traits (heart rate and intervals) are correlated with each other and with body size parameters, sex and age. The correlation matrix is derived from measurements obtained from a total of 70 AB and wild-type fish from the kcnh6as290 and kcnh6atb218 lines. Positive correlations are colored in blue and negative correlations in red. The color intensity and size of the circles are proportional to the correlation (i.e. a correlation of 0.80 will have a larger and darker red circle than a correlation of 0.10).

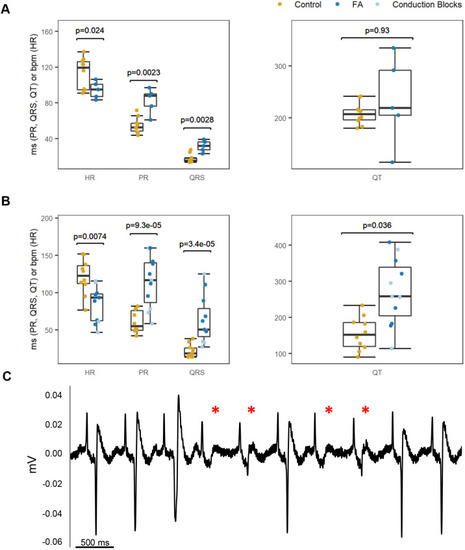
Impact of 0.800 mmol/l FA treatment on adult zebrafish cardiac electrophysiology. (A) Measurements were acquired from 15 adult zebrafish (5.2 months old) dosed for 30 min in either DMSO vehicle control (n=10) or FA (n=5). Compared with controls, FA-dosed fish displayed a slower heart rate (P=0.024) and significant prolongation of PR (P=0.0023) and QRS (P=0.0028) intervals. (B) Measurements were obtained from 21 adult zebrafish (3.5 months old) dosed for 15 min in either DMSO vehicle control (n=10) or FA (n=11). In addition to a significant decrease in heart rate (P=0.0074) and prolongation of PR (P=9.3×10⁻⁵) and QRS (P=3.4×10⁻⁵) intervals, FA-dosed fish in this experiment also displayed significant QT interval prolongation (P=0.036) compared with control fish. Several FA-dosed fish (n=6) within this independent experiment experienced conduction blocks (light blue points in B). The P-values in A and B were determined from a linear regression adjusting for sex and weight; QT interval was additionally adjusted for heart rate. QT interval plots show the measurement uncorrected for heart rate. (C) Representative trace from a 3.5-month-old male fish dosed with FA for 15 min; the red asterisks denote conduction blocks, as evidenced by the conduction failure (no QRS complex). The trace image was captured using LabChart ‘Zoom View.’

Delayed ventricular repolarization in kcnh6as290/+ mutants.kcnh6as290/+ (heterozygous) mutants displayed a longer QT interval than their kcnh6a+/+ (wild-type) clutchmates (P=0.021). Measurements were obtained from a total of 54 fish. The P-values were determined from a linear mixed model, in which the date of the ECG recording session was added as a random effect and age, ECG recording location, sex and weight were added as fixed effects; QT interval was additionally adjusted for heart rate. The QT interval plot shows the measurement uncorrected for heart rate.

Acknowledgments
This image is the copyrighted work of the attributed author or publisher, and ZFIN has permission only to display this image to its users. Additional permissions should be obtained from the applicable author or publisher of the image. Full text @ Dis. Model. Mech.