|
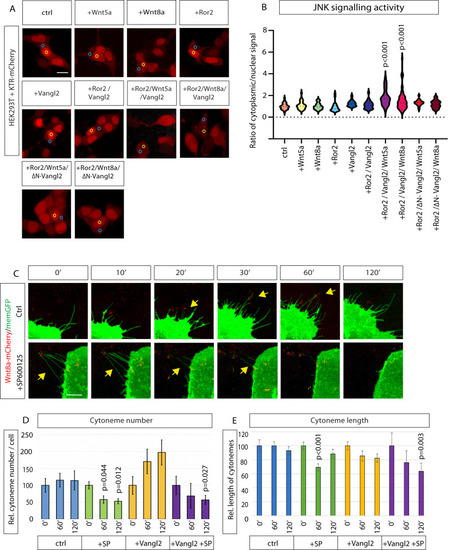
Vangl2 activates JNK signaling to control the formation of Wnt8a cytonemes.A HEK293T cells all transfected with KTR-mCherry and Wnt5a or Wnt8a protein, plus Ror2; Vangl2; Ror2 & Vangl2; Ror2 & ΔN-Vangl2. Wnt8a protein and Wnt5a protein (500 ng/ml) was also added to some conditions 24 h prior to imaging. Blue circle = nuclear, yellow circle = cytoplasmic. B Violin plot of normalized ratio of cytoplasmic to nuclear signal of KTR-mCherry. Increased ratio indicates increasing JNK activity. (n = 69, 32, 32, 25, 30, 24, 43, 75, 60, 49 cells). Two-sided Kruskal–Wallis tests with Bonferroni correction. SEM = 1. C Time series of PAC2 cells at 0 (0‘), 10, 20, 30, 60, and 120 min in control cells and cells post 20 µM SP600125 treatment. D Relative number of filopodia per cell in relation to time = 0 h, at 0, 60, 120 min. (n = 3, 6, 10, 4 cells. n = filopodia at 0, 1, 2 h = (102/111/109, 251/156/122, 158/185/215, 58/50/44). p values over + Sp600125 60′ & 120′ (green bars) significant to 0′. p value over Vangl2 + SP600125 120′ (purple) significant to Vangl2 0′ (yellow). E Relative filopodia length (µm) in relation to time = 0 h, at 0, 60, 120 min. (n = 3, 6, 13, 4 cells. n = filopodia at 0, 1, 2 h = (102/111/109, 251/156/122, 232/274/295, 58/50/44). p value over + Sp600125 60’ (green) significant to 0′. p values over Vangl2 + SP600125 120′ (purple) significant to Vangl2 0′ (yellow). Corresponding dot plot for D, E shown in Supplementary Fig. 6B. Statistical significance: p ≤ 0.05. D, E Two-sided Kruskal–Wallis tests without Bonferroni correction. SEM = 1. Scale bar = 10 µm. Source data are provided as a Source Data file.
|