|
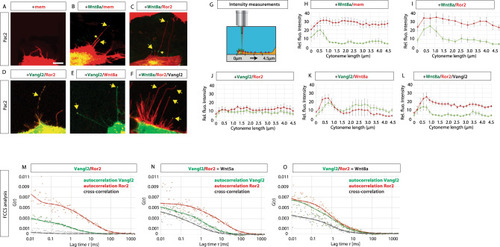
Vangl2 is present on the tips of Wnt8a positive cytoneme.A–F PAC2 zebrafish fibroblasts transfected with indicated constructs and analysed live at 24 h of post-transfection. Yellow arrows indicate Wnt8a on tips of cytonemes. White scale bar equals 5 μm. (n = 25, 9, 14, 6, 25, and 14 cells). G Fluorescent intensity measurements were recorded (H–L) along cytoneme length as illustrated in G, from tip at 0–4.5 μm along cytoneme. Cytonemes fluorescent intensity measurements were taken up to 4.5 μm from the cytoneme tip in each case. H–L Relative fluorescent intensity analysis (gray value) of tagged proteins Wnt8a-GFP, Wnt8a-mCherry, Mem-mCherry, Ror2-mCherry, and GFP-Vangl2, relative pixel intensity values were measured along cytoneme length starting at the cytoneme tip, (n = 17, 12, 12, 14, 11, and 12 filopodia). Standard error of the mean (SEM) = 1. M–O For the fluorescence correlation spectroscopy (FCS) analysis, a focused laser spot was scanned across the membrane for 16s while the intensity was measured as a function of time (G(t)). Auto-correlation curve in red and green for Ror2 and Vangl2, respectively. Cross-correlation curve in gray. Fluorescent cross-correlation spectroscopy (FCCS) revealed cross-correlation of Ror2-mCherry and GFP-Vangl2 when exposed to Wnt5a protein or Wnt8a protein. (n = 5 measurements/condition). CTRL D2 (Ror2) = (37 ± 5) µm2 s−1, D2 (Vangl2) = (23 ± 4) µm2 s−1, KD > 1100 nM; Wnt5a D2 (Ror2) = (14 ± 3) µm2 s−1, D2 (Vangl2) = (19 ± 5) µm2 s−1, KD = 173 nM; Wnt8a: D2 (Ror2) = (11 ± 2) µm2 s−1, D2 (Vangl2) = (16 ± 3) µm2 s−1, KD = 138 nM. Source data are provided as a Source Data file.
|