
FIGURE
Fig. 4 S1
- ID
- ZDB-FIG-160215-35
- Publication
- Yokota et al., 2015 - Endothelial Ca(2+) oscillations reflect VEGFR signaling-regulated angiogenic capacity in vivo
- Other Figures
- All Figure Page
- Back to All Figure Page
Fig. 4 S1
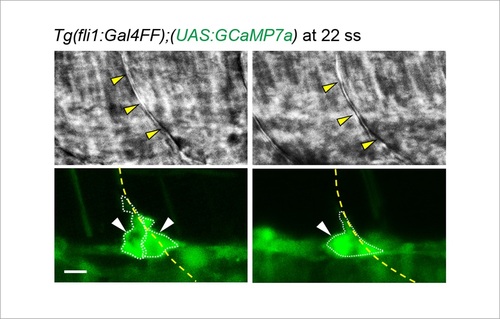
ECs close to somite boundaries have potential to sprout. Light-sheet z-stack fluorescence images of Tg(fli1:Gal4FF);(UAS:GCaMP7a) (lower) and corresponding 2D-slice bright-field (BF) images at the level of somite boundary (upper) just after vessel sprouting (22 ss). Yellow arrowheads indicate somite boundaries. Yellow dashed lines indicate positions of somite boundaries. White arrowheads indicate Ca2+-oscillating cells, either of which extends protrusions dorsally. Note that double (left) or single (right) Ca2+-oscillating cells are located at somite boundary. Scale bar, 10 µm. |
Expression Data
Expression Detail
Antibody Labeling
Phenotype Data
Phenotype Detail
Acknowledgments
This image is the copyrighted work of the attributed author or publisher, and
ZFIN has permission only to display this image to its users.
Additional permissions should be obtained from the applicable author or publisher of the image.
Full text @ Elife