
Fig. 5
- ID
- ZDB-FIG-140227-47
- Publication
- Melby et al., 1996 - Specification of cell fates at the dorsal margin of the zebrafish gastrula
- Other Figures
- (all 8)
- All Figure Page
- Back to All Figure Page
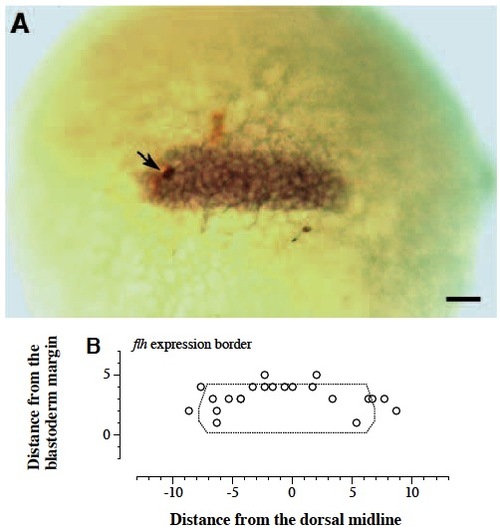
The flh RNA expression domain coincides with the notochord domain at the early gastrula stage. (A) Dorsal view of a double labeled gastrula. The cell marked with lineage tracer is stained brown (black arrow) and flh RNA is greenish-brown. Scale bar: 50 μm. (B) Map of the border of strongest flh expression. The axes of the graph are as in Fig. 3. Open circles represent the border of strongest flh expression determined relative to the coordinates of labeled cells. In some cases, both a lateral and a posterior boundary point were determined from a single labeled cell. The border of flh expression is defined as the outermost cell strongly expressing flh RNA. |
| Gene: | |
|---|---|
| Fish: | |
| Anatomical Term: | |
| Stage: | Shield |