
FIGURE
Fig. 2
- ID
- ZDB-FIG-111115-2
- Publication
- Jayasena et al., 2011 - Live imaging of endogenous periodic tryptophan protein 2 gene homologue during zebrafish development
- Other Figures
- All Figure Page
- Back to All Figure Page
Fig. 2
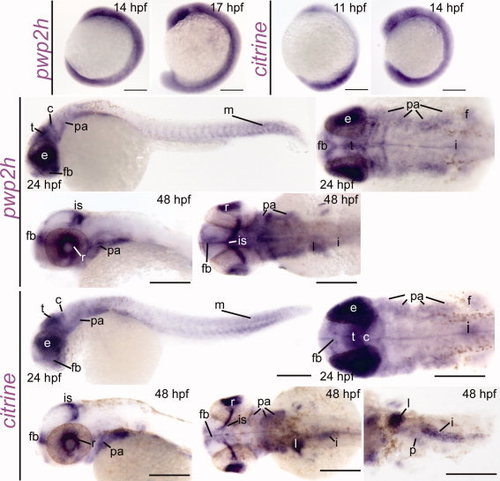
In situ hybridization showing expression comparison between pwp2h in wild-type and citrine expression in the Gt (pwp2h-citrine)ct143a. Lateral and dorsal views are shown for 24 hours post fertilization (hpf) and 48 hpf for pwp2h and citrine. Ventral view at 48 hpf shows citrine expression in the digestive tract. c, cerebellum; e, eye; f, pectoral finbuds; fb, forebrain; i, intestine; is, isthmus: l, liver; m, myotome; p, pancreas; pa, pharyngeal arches; r, retina; t, tectum. Scale bar = 200 μm. |
Expression Data
| Genes: | |
|---|---|
| Fish: | |
| Anatomical Terms: | |
| Stage Range: | 5-9 somites to Long-pec |
Expression Detail
Antibody Labeling
Phenotype Data
Phenotype Detail
Acknowledgments
This image is the copyrighted work of the attributed author or publisher, and
ZFIN has permission only to display this image to its users.
Additional permissions should be obtained from the applicable author or publisher of the image.
Full text @ Dev. Dyn.