
FIGURE
Fig. 5
Fig. 5
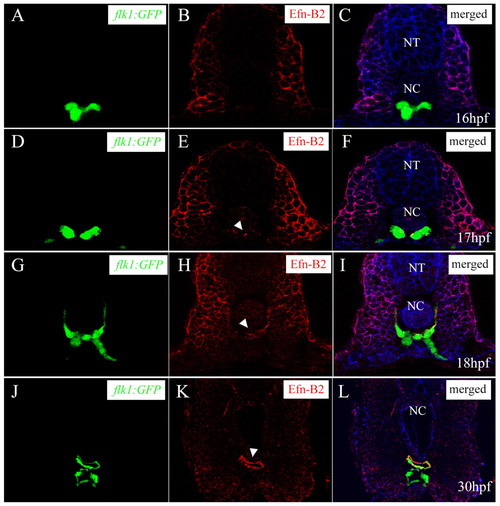
Differentiation of arterial endothelial cells within the vascular cord. Transverse sections visualized for GFP (A,D,G,J) (green), ephrin B2 (B,E,H,K) (red) and ß-catenin (C,F,I,L) (blue). Sections shown are at the level of the 7th (A to C), 10th (D to F), and 14th somite (G to L). Arrowheads mark the ephrinB2 expression within the vascular cord. Subsets of angioblasts within the vascular cord start to express ephrin B2 at 17 hpf, and this expression later becomes restricted to the DA. NT, neural tube; NC, notochord. |
Expression Data
Expression Detail
Antibody Labeling
Phenotype Data
Phenotype Detail
Acknowledgments
This image is the copyrighted work of the attributed author or publisher, and
ZFIN has permission only to display this image to its users.
Additional permissions should be obtained from the applicable author or publisher of the image.
Full text @ Development