
- Title
-
PCSK9 Loss-of-Function Disrupts Cellular Microfilament Network via LIN28A/HES5/JMY Axis in Neural Tube Defects
- Authors
- Li, X., Wang, R., Luo, W., Gu, H., Huang, T., Wang, Q., Yuan, Z.
- Source
- Full text @ Adv Sci (Weinh)
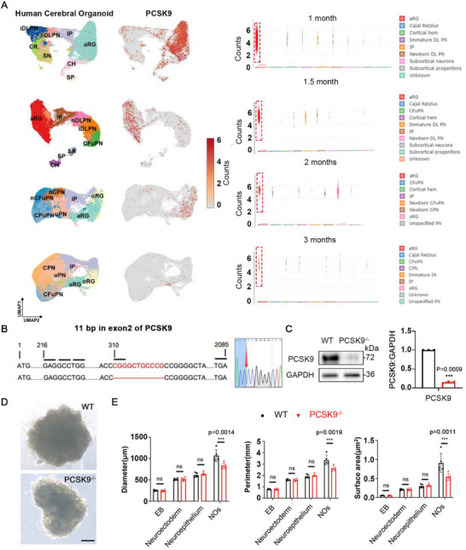
PCSK9 loss leads to changes in NOs size and NT structure. A) Cell‐type clusters, feature plot showing PCSK9 expression (left) and statistical results (right) in human cerebral organoids at different developmental time points. Dataset and cluster annotations were obtained from Uzquiano et al (2022), and the clustering and annotation from the original publication are kept unchanged. aRG: apical radial glia; oRG, outer radial glia; IP: intermediate progenitor; DL, deep‐layer; PN, projection neurons; iDLPN, immature DLPN; nDLPN, newborn DLPN; CFuPN, corticofugal projection neuron; CPN, callosal projection neuron; IN, interneurons; CR, cajal retzius; SN, subcortical neurons; CH, cortical hem; SP, subcortical progentors. B) CRISPR/Cas9‐mediated gene editing of the PCSK9 locus in ESCs resulted in an 11‐bp depletion in exon 2. C) Western blotting (WB) and quantification of PCSK9 expression in WT and PCSK9‐/‐ ESCs; n = 3 independent experiments. D) Representative images of WT and PCSK9‐/‐ NOs; scale bars, 1 mm. E) Quantification of diameter, perimeter, and surface area of NOs; n = 5 individual NOs. Values were mean ± SD. Statistical significance was determined using an unpaired two‐tailed Student's |

PCSK9 loss leads to disorganized cellular microfilaments in NPCs. A) NOs subjected to double immunofluorescence staining for TBR1 and SOX2 showed three distinct NT structures: the ventricle, ventricular zone (VZ), and subventricular zone/cortical plate SVZ/CP; scale bar, 100 µm. B) Immunofluorescence staining of TBR1+/CTIP2+ mature neurons in WT and PCSK9‐/‐ NOs. Representative images (left) and quantification (right) of TBR1+/CTIP2+ proportion in the mature neurons of the NT structure. The square shape indicates the NT structure, whereas the white circular or irregular shape represents the VZ region; n = 3 individual NOs; scale bar, 100 µm. C) Schematic diagram of NTDs caused by abnormal NTC. D) Immunofluorescent staining a) and fluorescence intensity quantification b) of cell microfilaments in the NT structures of WT and PCSK9‐/‐ NOs; n = 3 individual NOs; scale bar, 100 µm. E) Double immunofluorescence staining for PCSK9 and SOX2 showed the localization and expression of PCSK9 in the NT structure of WT NOs; scale bar, 20 µm. F) NPCs induction culture model map. G) Representative light microscopy images of WT and PCSK9‐/‐ NPCs; scale bar, 20 µm. H) Immunostaining and fluorescence intensity quantification of cell microfilaments in WT and PCSK9‐/‐ NPCs; n = 3 plates from WT and PCSK9‐/‐; scale bar, 100 µm. Values were mean ± SD. Statistical significance was determined using an unpaired two‐tailed Student's |
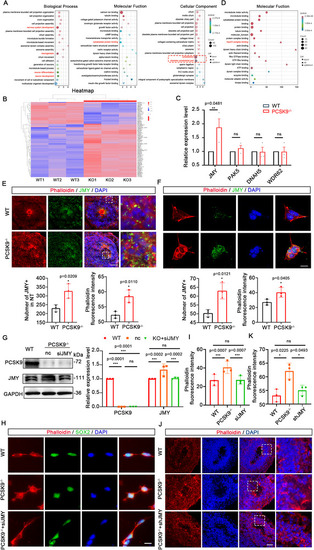
PCSK9 affects NT structure by regulating microfilament network formation in NPCs through JMY. A) Biological process‐, molecular function‐, and cellular component‐related items in the GO analysis. The red box shows the cytoskeletal and obsolete cytoskeletal part‐related items. Different colors represent different q values, ranging from red to blue, with q values increasing from small to large; the smaller the q value, the better the correlation. Graph size represents the number; a larger graph indicates more altered genes. In the entry, ▼ indicates downregulation of the altered gene; ▲ indicates upregulation of the altered gene; and ● indicates both upregulation and downregulation of the altered genes. B) Heat map of all DEGs in cytoskeletal proteins. The three rows on the left are the WT group, and the three rows on the right are the PCSK9‐/‐ group. Red indicates high expression, and blue indicates low expression. C) Statistical results of qPCR validation of the altered genes. D) Molecular function‐related items of cytoskeletal proteins. The red box shows the Arp2/3 complex binding entry where JMY is located. E,F) Immunofluorescence staining (up) and statistical results (down) of the expression and colocalization of JMY and cell microfilaments on the NT structure of NOs (E) and NPCs (F); n = 3 individual experiments; scale bar, 100 µm (E), 10 µm (F). G) WB and quantification of PCSK9 and JMY protein levels in WT and PCSK9‐/‐ NPCs after siJMY rescue experiments; n = 3 individual experiments. H,I) Immunofluorescence staining and fluorescence intensity quantification of cell microfilaments in WT and PCSK9‐/‐ NPCs with and without siJMY rescue; n = 3 plates from WT, PCSK9‐/‐, and PCSK9‐/‐ +siJMY; scale bar, 20 µm. J,K) Immunofluorescence staining and fluorescence intensity quantification of cell microfilaments in WT and PCSK9‐/‐ NT structure with and without shJMY rescue; n = 3 individual NOs; scale bar, 100 µm. Values were mean ± SD. Statistical significance was determined using an unpaired two‐tailed Student's |
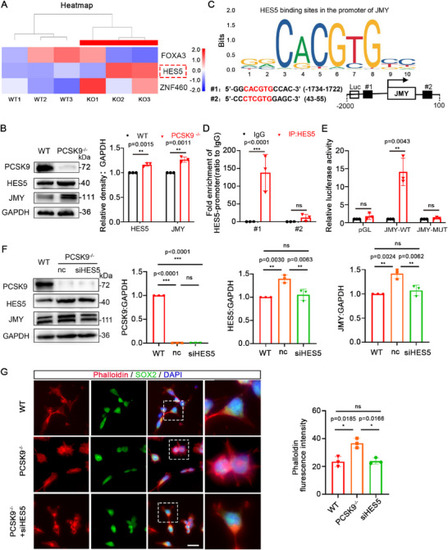
HES5 acts as a transcription factor and regulates JMY expression. A) Heat map of FOXA3, HES5, and ZNF460 expression levels in the transcriptome database. The three rows on the left pertain to the WT groups, and the three on the right to the PCSK9‐/‐ groups. Red indicates high expression, and blue indicates low expression. B) WB and quantification of PCSK9, HES5, and JMY protein levels in WT and PCSK9‐/‐NOs; n = 3 independent experiments. C) Prediction of HES5–JMY binding sites. D) ChIP‐qPCR analysis of HES5 enrichment at two sites of the JMY promoter; n = 3 individual experiments. E) Luciferase reporter gene experiments verified that HES5 exhibits transcriptional activity against JMY; n = 3 individual experiments. F) WB and quantification of PCSK9, HES5, and JMY protein levels in NPCs after siHES5 rescue experiments; n = 3 individual experiments. G) Immunofluorescence staining and fluorescence intensity quantification of cell microfilaments in WT and PCSK9‐/‐ NPCs with and without siHES5 rescue; n = 3 plates from WT, PCSK9‐/‐, and PCSK9‐/‐ +siHES5; scale bar, 20 µm. Values were mean ± SD. Statistical significance was determined using an unpaired two‐tailed Student's |
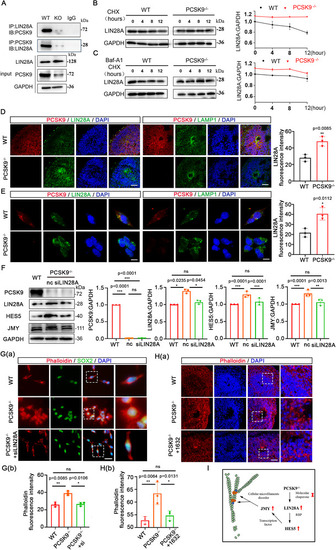
PCSK9 affects NT structure by promoting LIN28A degradation through the lysosomal pathway. A) Co‐IP detection of the interaction between PCSK9 and LIN28A. B) WB and quantification of LIN28A protein levels of NPCs after CHX (10 mM) treatment; n = 3 individual experiments. C) WB and quantification of LIN28A protein levels of NPCs after CHX (10 m |
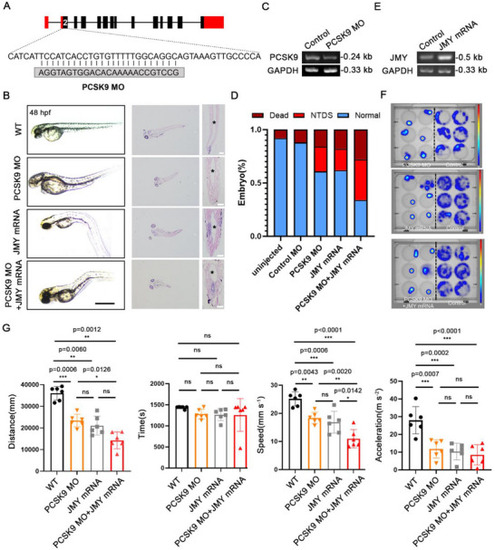
JMY aggravates PCSK9 loss‐induced NTDs in zebrafish. A) Detailed base diagram of the second exon region of zebrafish designed using PCSK9‐MO, resulting in 25 bp depletion. B) Effects of PCSK9‐MO, JMY‐mRNA, and their combined administration on the development of the zebrafish NTs. The left side shows the light microscopy image, and the right side shows a cross‐sectional HE‐stained image and an enlarged NT structure image. “*” indicates the neural cavity; scale bar, 1 mm (left) and 50 µm (right). C) RT‐PCR detection of PCSK9 expression after PCSK9‐MO administration. D) Percentage of incidence and mortality of zebrafish NTDs in the PCSK9‐MO, JMY‐mRNA, and combined treatment groups; n = 100 zebrafishes per group. E) RT‐PCR detection of JMY expression after JMY mRNA administration. F) Thermal images of zebrafish activities in the PCSK9‐MO, JMY‐mRNA, and combined administration groups. The right side shows the control group, and the left side shows the deformity group. G) Statistical analysis of zebrafish‐related behaviors in the PCSK9‐MO, JMY‐mRNA, and combined administration groups. The first group shows the distance of movement, the second group shows time, the third group shows speed, and the fourth group shows acceleration; n = 6 individual experiments. Values were mean ± SD. Statistical significance was determined using one‐way ANOVA with the Dunnet post hoc test (G); ns: |

The schematic diagram of our findings. PCSK9 acts as a molecular chaperone that promotes LIN28A degradation via the lysosomal pathway. Furthermore, LIN28A, an RNA‐binding protein, ultimately affects the expression of JMY by regulating the transcription factor HES5. Aberrant elevation of JMY influences the organization of the cellular microfilament network, thereby impacting cell morphology. |