
- Title
-
5,7,3',4',5'-Pentamethoxyflavone (PMF) Exhibits Anti-Obesity and Neuroprotective Effects in an Obese Zebrafish Model
- Authors
- Vohra, M.S., Ahmad, B., Taylor, E.R., Benchoula, K., Fong, I.L., Parhar, I.S., Ogawa, S., Serpell, C.J., Wong, E.H.
- Source
- Full text @ Mol. Cell. Endocrinol.
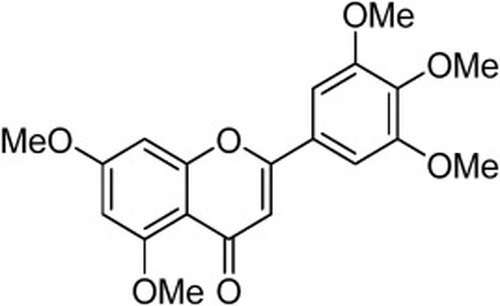
Structure of 5,7,3′,4′,5′-pentamethoxyflavone, used in the study. |

Development of the obesity model in adult zebrafish via overfeeding with a high fat diet. |
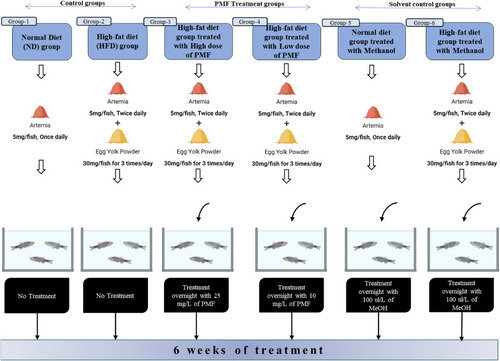
Schematic diagram of PMF treatment design of obesity in HFD induced zebrafish model. |

Quantification of acute toxicity of PMF in adult zebrafish. (A) 96-h probit analysis showing dose-dependent mortality following exposure to increasing concentrations of PMF. (B) Representative images illustrating acute toxicity effects of PMF. Zebrafish exposed to control (0 mg/mL), 24 mg/mL, 26 mg/mL, 28 mg/mL, and 30 mg/mL PMF displayed normal morphology and behaviour after 96 h. In contrast, exposure to higher concentrations (32–44 mg/mL) induced clear toxic effects characterized by reduced locomotive activity, spinal curvature, discoloration, lethargy, internal hemorrhaging (red arrows), and mortality observed between 24 and 72 h post-treatment. |
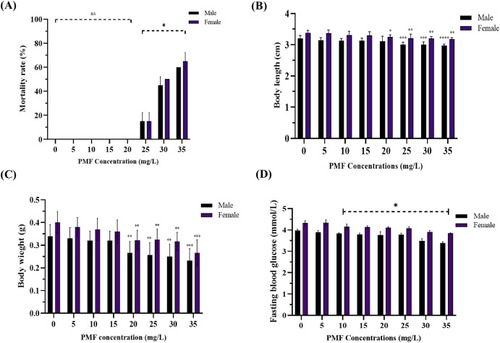
Quantification of chronic toxicity of PMF in male and female zebrafish treated with different concentrations (mg/L) of PMF respectively. (A) A 14-day fish prolonged mortality results (Duplicates, n = 10/gender). (B) Body length (Duplicates, n = 10/gender). (C) Wet body weight (Duplicates, n = 10/gender). (D) Fasting blood glucose levels (Triplicates, n = 5). All data were expressed as means (±SD). Statistical analyses were performed using Two-Way ANOVA followed by Šidák multiple comparison and significant differences were indicated as ∗P<0.05, ∗∗P<0.01, ∗∗∗P<0.001 and ∗∗∗∗P<0.0001. |
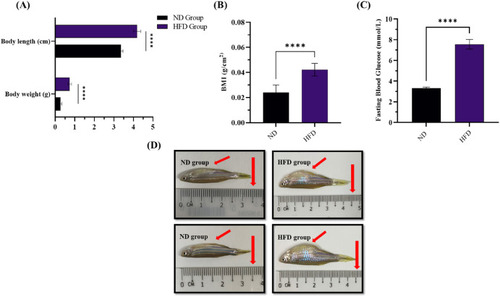
Development of obese zebrafish groups following overfeeding with HFD and ND. (A) Body weight and length (n = 30). Statistical analysis was performed using Two-Way ANOVA followed by Bonferroni post-test and significant differences are indicated as ∗P<0.05, ∗∗P<0.01, ∗∗∗P<0.001 and ∗∗∗∗P<0.0001. (B) BMI (n = 30). (C) Fasting blood glucose levels (n = 10). All data expressed as means (±SD). Statistical analyses were performed using One-Way ANOVA followed by Paired t-test and significant p-values were indicated as ∗P<0.05, ∗∗P<0.01, ∗∗∗P<0.001 and ∗∗∗∗P < 0.0001. (D) Exemplary images of zebrafish included in each of the analysed dietary groups at 6 weeks endpoint. Red arrows point to the body length and abdominal region. BMI: Body mass index, ND: Normal diet, HFD: High-fat diet. |
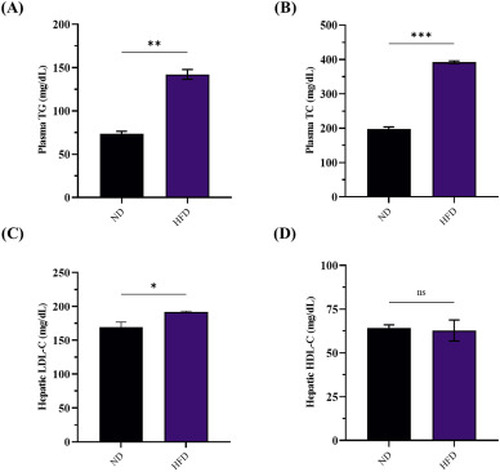
Biochemical and lipid assessment in ND versus HFD zebrafish groups. (A) TG levels (n = 4). (B) TC levels (n = 6). (C) LDL-C levels (n = 6). (D) HDL-C levels (n = 5). All the values are expressed as means (±SD) in triplicates. Statistical analyses were performed using One-Way ANOVA followed by Paired t-test and significant p-values were indicated as ∗P<0.05, ∗∗P<0.01, ∗∗∗P<0.001 and ‘ns’ indicates no significant difference, ND: normal diet, HFD: high-fat diet. |
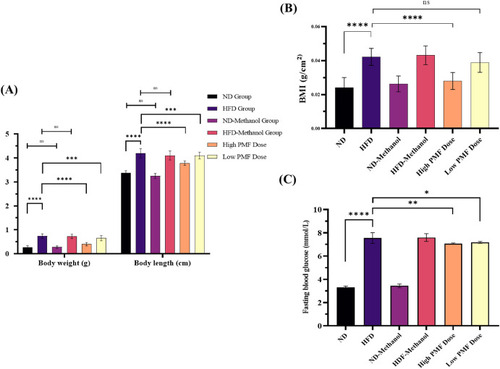
Effects of PMF on BMI and fasting blood glucose levels of all treatment groups at 6-week endpoint. (A) Body weight and length (n = 30). (B) BMI (n = 30). (C) Fasting blood glucose levels (n = 10). All the values are expressed as means (±SD). Statistical analyses were performed using One-Way and Two-Way ANOVA followed by Tukey-test, and significant p-values were indicated as ∗P<0.05, ∗∗P<0.01, ∗∗∗P<0.001, ∗∗∗∗P < 0.0001. ns: no significant difference, BMI: body mass indes, ND: normal diet, HFD: high-fat diet |
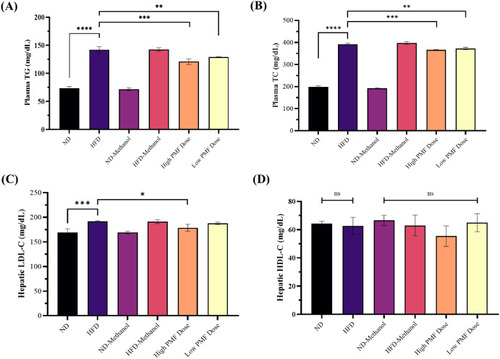
Effects of PMF on blood and lipid parameters. (A) TG levels (n = 4). (B) TC levels (n = 6). (C) Hepatic LDL-C levels (n = 6). (D) Hepatic HDL-C levels (n = 6). All the values are expressed as means (±SD) in triplicates. Statistical analysis was performed using One-Way ANOVA followed by Tukey-test, and significant p-values were indicated as ∗P<0.05, ∗∗P<0.01, ∗∗∗P<0.001 and ∗∗∗∗P < 0.0001. ns: no significant difference, ND: normal diet, HFD: high-fat diet. |
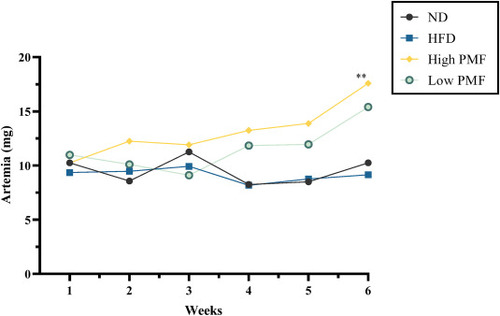
Measurement of feeding intake (mg). The values are showed as means (±SD), n = 10, Feeding = 5mg/fish. Statistical analysis was performed using One-Way ANOVA followed by post-test Tukey multiple comparison and significant p-values were indicated as ∗P<0.05 and ∗∗P<0.001. ND: normal diet, HFD: high-fat diet. |

Effects of PMF on Oxidative stress (OS) markers. (A & B) Liver and brain MDA levels (Liver: n = 4, Brain: n = 3). (C–D) Liver and brain NO levels (Liver: n = 6, Brain: n = 4). Values are means (±SD) in triplicates. Statistical analyses were performed using One-Way ANOVA followed by Tukey-test and significant p-values were indicated as ∗P<0.05, ∗∗P<0.01, ∗∗∗P<0.001 and ∗∗∗∗P < 0.0001. ND: normal diet, HFD: high-fat diet, ns: no significant difference. |
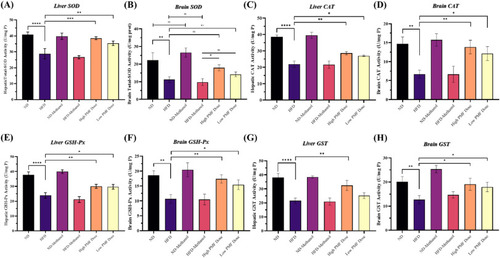
Effects of PMF on Antioxidative enzyme activities. (A–B) Liver and brain Total-SOD levels (Liver: n = 4, Brain: n = 5). (C–D) Liver and brain CAT levels (Liver: n = 5, Brain: n = 4). (E–F) Liver and brain GSH-Px levels (Liver: n = 7, Brain: n = 4). (G–H) Liver and brain GST activity (Liver: n = 6, Brain: n = 4). All values are means (±SD) in triplicates. Statistical analyses were performed using One-Way ANOVA followed by post-test Tukey multiple comparison and significant p-values were indicated as ∗P<0.05, ∗∗P<0.01, ∗∗∗P<0.001 and ∗∗∗∗P < 0.0001. ND: normal diet, HFD: high-fat diet. |
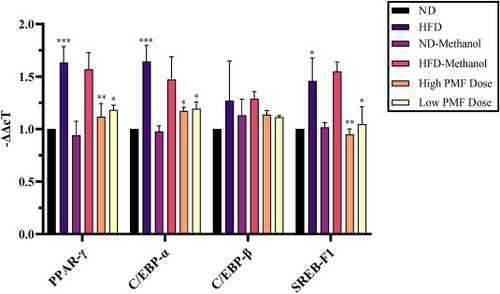
Effects of PMF exposure on the expression of positive adipogenic factor genes in hepatocytes of zebrafish overfed for 6 weeks. Data represented as means (±SEM), n = 6. Statistical analysis was performed using Two-Way ANOVA followed by Bonferroni post-test and significant p-values indicated as ∗P<0.05, ∗∗P<0.01 and ∗∗∗P<0.001. mRNA expression values were normalized with β-Actin expressed as a ratio of the ND group. ND, normal diet; HFD, high fat diet. |

Effects of PMF exposure on the expression of lipogenic and lipolytic (factors and direct targeted) genes in hepatocytes of zebrafish overfed for 6 weeks. Data represented as means (±SEM), n = 6. Statistical analysis was performed by Two-Way ANOVA followed by Bonferroni post-test and significant p-values indicated as ∗P< 0.05, ∗∗P<0.01 and ∗∗∗P<0.001. The mRNA expression values were normalized with β-Actin expressed as a ratio of the HFD group. ND, normal diet; HFD, high fat diet. |

PMF can modulate the expression of selected appetite responsible-orexigenic and -anorexigenic genes in zebrafish brain overfed for 6 weeks. Data represents as means (±SEM), n = 8. Statistical analyses were performed by Two-Way ANOVA followed by Bonferroni post-test and significant p-values indicated as ∗p<0.05, ∗∗p<0.01, ∗∗∗p<0.001 and ∗∗∗∗p<0.0001. mRNA expression values were normalized with β-Actin expressed as a ratio of the ND group. ND, normal diet; HFD, high fat diet. |
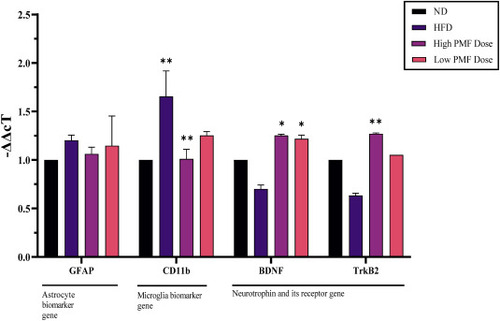
PMF can reduce the expression of inflammation-related gene and provides neuroprotective effect in zebrafish. Data represented as means (±SEM). (BNDF and TrkB2, n = 8). (GFAP and CD11b, n = 10). Statistical analysis was performed by Two-Way ANOVA followed by Bonferroni post-test and significant p-values were indicated as ∗P<0.05 and ∗∗P<0.01. mRNA expression values were normalized with β-Actin expressed as a ratio of the ND group. ND, normal diet; HFD, high fat diet. |
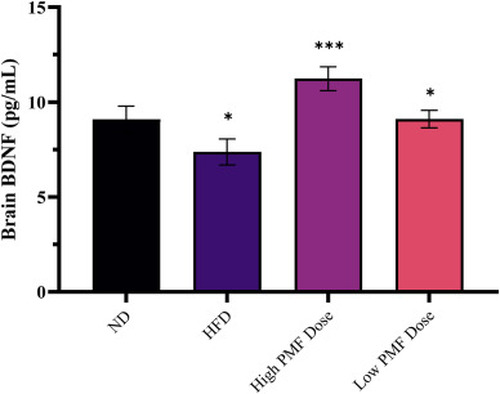
Brain BDNF contents of non-treated and treated zebrafish with high (25 mg/L) and low doses (10 mg/L) of PMF following HFD and ND for 6 weeks. Values are means (±SD) in triplicates, n = 8. Statistical analysis was performed using One-Way ANOVA followed by post-test Tukey multiple comparison and significant p-values were indicated as ∗P<0.05, ∗∗P<0.01 and ∗∗∗P<0.001. ND; normal diet, HFD; high-fat diet. |
Reprinted from Molecular and Cellular Endocrinology, , Vohra, M.S., Ahmad, B., Taylor, E.R., Benchoula, K., Fong, I.L., Parhar, I.S., Ogawa, S., Serpell, C.J., Wong, E.H., 5,7,3',4',5'-Pentamethoxyflavone (PMF) Exhibits Anti-Obesity and Neuroprotective Effects in an Obese Zebrafish Model, 112554112554, Copyright (2025) with permission from Elsevier. Full text @ Mol. Cell. Endocrinol.