FIGURE SUMMARY
Title

Forward genetic screen in zebrafish identifies new fungal regulators that limit host-protective Candida-innate immune interaction

Authors
Blair, B.A., Bragdon, E., Dhillon, G., Baker, N., Stasiak, L., Muthig, M., Miramon, P., Lorenz, M.C., Wheeler, R.T.
Source
Full text @ MBio

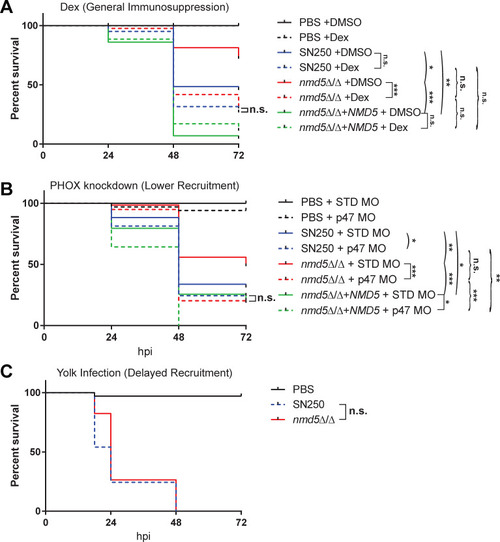
Defining infection parameters. (A) Flow chart showing the workflow of pilot experiments. Hindbrain infections were performed at the prim-25 stage, and fish were then screened to ensure they received the correct inoculum (10–25 cells). At 4–6 hours postinfection, fish were imaged by confocal microscopy to score fungal phagocytosis; survival was monitored out to 72 hpi. (B) Example Kaplan-Meier survival curves pooled from three experiments showing the fish injected with PBS (control, n = 83), SN250 (WT, n = 61), adr1∆/∆ (n = 63), or mad2∆/∆ (n = 57). Fish injected with mad2∆/∆ showed increased survival compared to SN250 (P = 0.0001). (C) Survival of fish injected with each strain at 72 hpi in three independent experiments. Individual points represent biologically independent experiments on different days. Bars show means and standard deviations with SN250 in red to depict WT cutoff range for inclusion of experiments. Significant differences in survival curves were determined by Mantel-Cox log-rank tests comparing the mutant strain to SN250 from data pooled from three biological replicates of the same experiments. Two mutants were tested per experiment, and Bonferroni corrections were performed. (D) Representative images of hindbrain ventricle infection to score fungal phagocytosis at 4 hpi. C. albicans initial inoculum was stained with Calcofluor white, shown in blue. The hindbrain ventricle is outlined by white dashed lines. Scalebar is 50 µm. Arrows point to extracellular Candida, while arrowheads point to intracellular Candida. (E) Quantification of the percent of intracellular Candida. Fungal cells were scored as intracellular or extracellular from z-stack slices (using Calcofluor fluorescence for the fungi and differential interference contrast [DIC] for imaging the phagocytes) of individual fish taken at 4–6 hpi for each strain. Based on at least 19 fish from at least three independent experiments. Significance and effect size were determined as described in Materials and Methods and based on reference 38. *P < 0.05, **P < 0.01, ***P < 0.001.

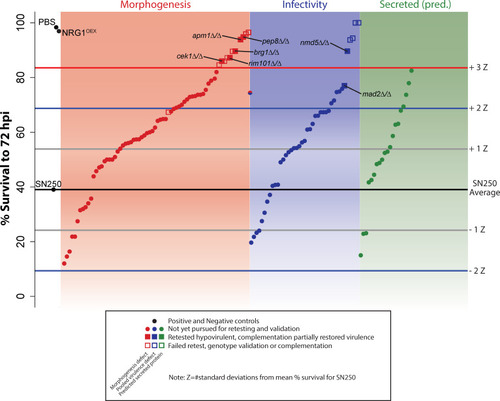
High-throughput virulence screening. Average survival of fish infected with individual mutant C. albicans strains (n ≈ 50 fish per mutant strain). Mock-infected (PBS) and NRG1OEX-infected fish were included as controls. The average survival of the WT SN250 strain is shown by the black line, while differential survival was measured by z-score (based on the standard deviation of % survival in over 20 experiments with SN250 control infections). Gray lines show a z-score = 1, blue lines show a z-score = 2, and red, a z-score = 3. Strains in the red panel were previously seen to have a morphogenesis defect on Spider agar, while those in the blue panel showed a defect in pooled virulence tests, and those in the green panel code for predicted secreted proteins. Mutant strains that had a z-score of over 3 were passed to the next phase of screening, shown as squares. Strains in which both independent mutants showed hypovirulence had their genotypes PCR-confirmed and in which complementation restored virulence are shown as filled squares and were passed to the imaging phase of screening. Those that did not pass secondary screening are shown as empty squares. Complete data are found in Table S1.

Complementation restores virulence to hypovirulent C. albicans mutants. Kaplan-Meier survival curves show restoration of virulence with complementation. All data in survival curves are pooled from two experiments unless otherwise noted. (A) Fish injected with SN250 (WT, n = 37), brg1∆/∆ (n = 37), brg1∆/∆+BRG1 (n = 45), PBS (mock, n = 20). Complementation of brg1∆/∆ restores some virulence. (B) Fish injected with SN250 (WT, n = 49), pep8∆/∆ (n = 75), pep8∆/∆+PEP8 (n = 57), or PBS (mock, n = 30). Complementation of pep8∆/∆ restores some virulence (data pooled from three experiments). (C) Fish injected with PBS (mock, n = 20), SN250 (WT, n = 37), nmd5∆/∆ (n = 44), nmd5∆/∆+NMD5 (n = 41). Complementation significantly increases virulence of nmd5∆/∆. (D) Fish injected with SN250 (WT, n = 45), rim101∆/∆ (n = 43), rim101∆/∆+RIM101 (n = 41), or mock-infected fish (PBS, n = 20). Complementation of rim101∆/∆ restores virulence (data pooled from three independent experiments). (E) Fish injected with SN250 (WT, n = 35), cek1∆/∆ (n = 41), cek1∆/∆+CEK1 (n = 45), or mock-infected fish (PBS, n = 19). Complementation of cek1∆/∆ restores virulence. (F) Fish injected with PBS (mock, n = 21), SN250 (WT, n = 34), apm1∆/∆ (n = 39), or apm1∆/∆+APM1 (n = 28). Complementation significantly increases virulence of apm1∆/∆. (G) Fish injected with PBS (mock, n = 18), SN250 (WT, n = 40), mad2∆/∆ (n = 43), or mad2∆/∆+MAD2 (n = 39). Complementation significantly increases virulence of mad2∆/∆. *Padj < 0.05, **Padj < 0.01, ***Padj< 0.001, ****Padj< 0.0001.

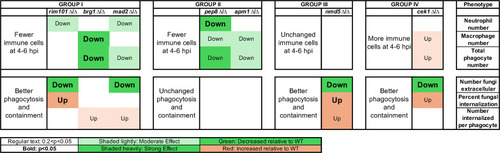
Mutants grouped by altered innate immune response. Mutant–phagocyte interactions were scored at 4–6 hpi, relative to wild-type fungi–phagocyte interactions in the same experiment, as to immune cell number and phagocytosis efficiency traits. Group I mutants had lower numbers of recruited phagocytes and better phagocytosis and containment. Group II mutants had fewer recruited phagocytes and unchanged phagocytosis efficiency. The Group III mutant had no change in phagocyte recruitment but better phagocytosis. The Group IV mutant had higher phagocyte recruitment and better phagocytosis. “Down” or “up” text indicates the direction of differential immune response, bold lettering indicates P < 0.05, and regular lettering indicates 0.2 < P < 0.05. Heavy shading indicates strong effect size; light shading indicates moderate effect size.

Phagocyte recruitment to hypovirulent C. albicans mutants. (A) Example representative images from brg1∆/∆, pep8∆/∆ and cek1∆/∆-infected fish, along with SN250-infected controls, at 4–6 hours postinfection. Images were scored by eye for the number of macrophages (mpeg1:GFP+ cells) shown in green and the number of neutrophils (lysC:dsRed+ cells) in magenta recruited to the infection, as well as if the Candida was intracellular or extracellular. Scale bar is 100 µm. (B–D) Quantification of phagocyte recruitment-related phenotypes. There are separate SN250 columns for each set of experiments, as the mutant was compared to wild type in the same experiments. (B) Plots showing the number of mpeg:GFP+ macrophages recruited to the infection site normalized to the average amount of mpeg:GFP+ macrophages recruited to SN250. (C) Plots showing the number of lysC:dsRed+ neutrophils recruited to the infection site normalized to the average amount of lysC:dsRed+ neutrophils recruited to SN250. (D) Plots showing the number of cells recruited to the infection site normalized to the average recruited to SN250. Cells include mpeg1:GFP+ and lysC:dsRed+ cells recruited to the hindbrain, as well as non-fluorescent cells containing Candida. (B–D) Shading indicates Groups I–IV based on similar interaction phenotypes (Fig. 4). Means and 95% confidence intervals are plotted. Statistics were performed from data pooled from at least three independent experiments for each mutant, for approximately 25 fish per strain were imaged. Hedges bias-corrected effect sizes and significance were determined for each mutant. * indicates P < 0.05, # indicates a moderate effect, while a bold # indicates a strong effect.

Phagocytosis of hypovirulent C. albicans mutants. (A) Example representative images from nmd5∆/∆, rim101∆/∆ and mad2∆/∆-infected fish, along with SN250-infected controls, at 4–6 hours postinfection. Images were scored by eye for the number of macrophages (Mpeg1-GFP+ cells) shown in green and the number of neutrophils (LysC-dsRed+ cells) in magenta recruited to the infection, as well as if the Candida was intracellular or extracellular. Scale bar is 100 µm. (B–D) Quantification of phagocytosis-related phenotypes. There are separate SN250 columns for each set of experiments, as the mutant was compared to wild type in the same experiments. (B) Plots of the percent intracellular Candida normalized to the average percent intracellular Candida for SN250. (C) Plots showing the number of extracellular Candida normalized to the average amount for SN250. (D) Plots showing the number of intracellular Candida, divided by the number of cells recruited, normalized to the average for SN250. (B–D) Shading indicates Groups I–IV based on similar interaction phenotypes (Fig. 4). Means and 95% confidence intervals are plotted. Statistics were performed from pooled data from at least three independent experiments for each mutant, for approximately 25 fish per strain imaged. Hedges bias-corrected effect sizes and significance were determined for each mutant. * indicates P < 0.05, # indicates a moderate effect, while a bold # indicates a strong effect.

Fungal morphology at 4–6 hpi. Mutant fungal morphology was scored at 4–6 hpi, relative to wild-type fungal morphology in the same experiment. Two of the three Group I mutants and both the Group II mutants had decreased filamentous growth at 4–6 hpi. “Down” text indicates decreased filamentous morphology (pseudohyphal/hyphal). Bold lettering indicates P < 0.05. Heavy shading indicates strong effect size; light shading indicates moderate effect size.

Hypovirulent C. albicans mutants elicit a reduced proinflammatory expression at 24 hpi. Expression of cxcl8b (A), tnfa (B), or il1b (C) by qPCR analysis of fish infected with WT (SN250), mutant (nmd5∆/∆, brg1∆/∆, or pep8∆/∆), or complemented (nmd5∆/∆+NMD5, brg1∆/∆+BRG1, or pep8∆/∆+PEP8) C. albicans at 24 hpi. Each point represents a pool of at least five larvae, and data were pooled from three (NMD5) or four (BRG1 and PEP8) independent experiments. Gene expression was normalized to gapdh, and induction was determined relative to PBS mock-infected larvae. Significance was determined by one-way ANOVA with Dunnett’s multiple comparisons tests.

nmd5∆/∆ has fully restored virulence in fish with a reduced immune response. (A) Kaplan-Meier survival curve of dexamethasone-treated hindbrain-injected fish with PBS (n = 28), SN250 (n = 41), nmd5∆/∆ (n = 43), or nmd5∆/∆+NMD5 (n = 35), or DMSO fish injected with PBS (n = 28), SN250 (n = 36), nmd5∆/∆ (n = 43), or nmd5∆/∆+NMD5 (n = 43). Data pooled from three independent experiments. (B) Kaplan-Meier survival curve of standard morphant fish injected with PBS (n = 22), SN250 (n = 46), nmd5∆/∆ (n = 39), or nmd5∆/∆+NMD5 (n = 35), and p47 morphant fish injected with PBS (n = 20), SN250 (n = 59), nmd5∆/∆ (n = 26), or nmd5∆/∆+NMD5 (n = 34). Data pooled from four independent experiments. (C) Kaplan-Meier survival curve of PBS (n = 34), SN250 (n = 37), or nmd5∆/∆ (n = 34) yolk-injected fish. Data pooled from two independent experiments. Statistics were performed as described in detail in Materials and Methods. Pairwise comparisons that are shown by arcs are confirmatory based on previous experiments; those shown by brackets are exploratory and adjusted for multiple comparisons by Bonferroni correction. Square brackets show if there is an effect of an immune perturbation on survival; curved brackets show if there is an effect of genotype on survival in the context of an immune perturbation. n.s., Padj > 0.05; *Padj < 0.05; **Padj < 0.01; ***Padj < 0.001.

Acknowledgments
This image is the copyrighted work of the attributed author or publisher, and ZFIN has permission only to display this image to its users. Additional permissions should be obtained from the applicable author or publisher of the image. Full text @ MBio