
- Title
-
Curcumin-mediated NRF2 induction limits inflammatory damage in, preclinical models of cystic fibrosis
- Authors
- Leon-Icaza, S.A., Frétaud, M., Cornélie, S., Bureau, C., Yatime, L., Floto, R.A., Renshaw, S.A., Herrmann, J.L., Langevin, C., Cougoule, C., Bernut, A.
- Source
- Full text @ Biomed. Pharmacother.
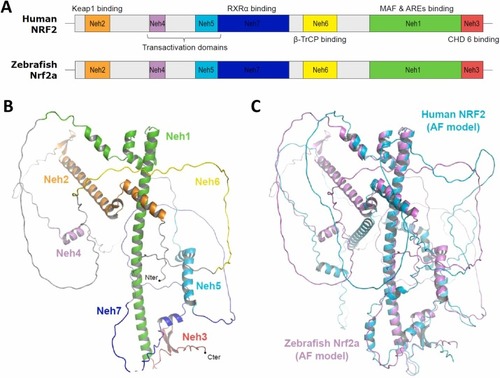
Structural analysis of zebrafish Nrf2a and comparison with human NRF2. (A) Domain organization of human NRF2 (hNRF2), with the target binding partners indicated for each domain, and predicted domain organization for zebrafish Nrf2a. All seven Neh domains seem to be present in Nrf2a. (B) 3D-structure of zebrafish Nrf2a predicted with AlphaFold. In this model, long unstructured regions alternate with shorter regions adopting defined secondary structures, mostly α-helices. The Neh domains are represented with the same color code as in panel A. (C) Structural overlay of the AlphaFold-predicted model for zebrafish Nrf2a (light purple) with that of hNRF2 (cyan). The position of the secondary structure elements within the Nrf2a model matches well with those predicted for hNRF2. |
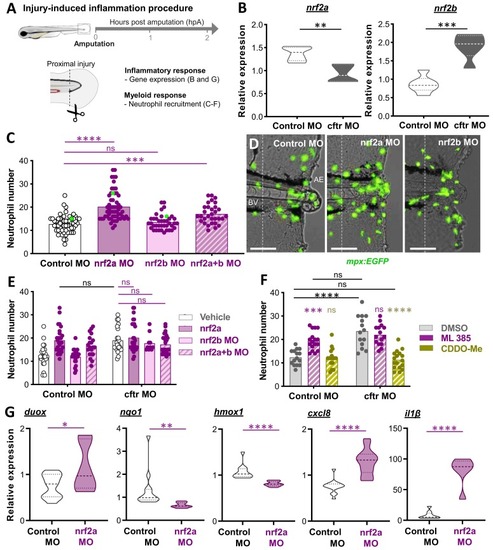
Injury-induced inflammatory responses are exacerbated in the absence of Nrf2 signaling in zebrafish larvae. (A) Schematic of injury-induced inflammation assay and analyses. Caudal fin amputations (dotted lined) were performed proximally through the notochord (N) at 3 days post-fertilization (dpf). (B) Control (control morphant (MO)) and cftr MO (generated using the validated cftr morpholino [15]) were caudal fin amputated then the level expressions of mRNA for nrf2a (left) and nrf2b (right) genes are evaluated at 2 hours post-amputation (hpA) by RT qPCR. Graphs showing the fold change over total tissue from uninjured larvae (relative gene expression from at least 3 independent experiments performed in triplicates, mean and quartiles shown, Two-tailed Student t-test). (C–E) Neutrophil mobilization to tissue injury in the neutrophil-specific TgBAC(mpx:EGFP)i114 line [18] is observed and enumerated at 2 hpA under a fluorescence microscope. The neutrophil count area is defined as the region between the blood vessels (BV) end and the amputation edge (AE). (C) Number of neutrophils mobilized to the wound in control MO, nrf2a MO, nrf2b MO or double nrf2a MO / nrf2b MO (nrf2a+b MO). Each dot represents the number of neutrophils at the wound in a single larva (3 independent experiments, One-way ANOVA with Dunnett’s comparisons test). (D) Representative images of injured tails (scale bars, 100 μm). The images are denoted as green data points in (C). (E) Inhibition of nrf2a, nrf2b or nrf2a+b was carried out in control and CF animals by injecting the nrf2a morpholino, the nrf2b morpholino or the nrf2a + nrf2b morpholinos reciprocally. Neutrophil recruitment assay (3 independent experiments, Two-way ANOVA with Tukey’s multiple comparisons test). (F) Control MO and cftr MO TgBAC(mpx:EGFP)i114 were treated with the NRF2 inhibitor ML 385, the NRF2 agonist CDDO-Me or DMSO as mock control prior to caudal fin amputation procedure, then injured and immediately put back in treatments. Neutrophil number at injured tails were enumerated at 2 hpA (3 independent experiments, Two-way ANOVA with Tukey's multiple comparisons test). (G) Relative expression of mRNA for duox, nqo1, hmox1, cxcl8 and il1β at 2 hpA (duox, cxcl8 and il1β) or 8 hpA (nqo1 and hmox1) were determined by RT qPCR. (from at least 3 independent experiments performed in triplicates,mean and quartiles shown, Two-tailed Student t-test). |
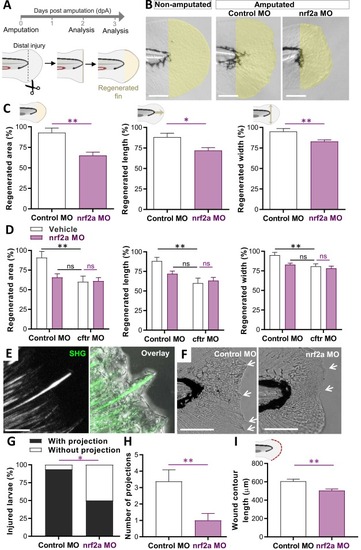
Nrf2a-depleted zebrafish exhibit reduced tissue repair responses after injury. (A-I) Tissue repair performance assessment. Caudal fin amputations were performed without injury to the notochord (dotted line) at 2 dpf, then the potential of tissue repair was evaluated at 2 (E-I) or 3 (B-D) days post-amputation (dpA). (B-C) Control MO and nrf2a MO were caudal fin amputated. Representative imaging of injured tail fin (scale bars, 100 μm) (B) and measurement of regenerated fin areas, lengths and widths (C) (n = 14–18 from 3 independent experiments, Two-tailed Student t-test). Error bars represent standard error of the mean (SEM). The regenerated fin areas were defined as the region between the amputation edge and the end of the extended fin. The regenerated fin lengths were measured from the notochord tip to the end of the extended fin. The regenerated fin widths were defined as the max width measured from the amputation edge to the end of the extended fin. (D) Inhibition of nrf2a was carried out in WT and CF animals by injecting the nrf2a morpholino. Measurement of regenerated tail fin areas, lengths and widths in the presence or absence of nrf2a (n = 16 from 3 independent experiments, Two-way ANOVA with Tukey's multiple comparisons test). (E) SHG and high magnification bright field imaging showing epithelial projection associated with collagen fibbers (scale bar, 10 μm). (F) Representative bright field microscopy of injured caudal fin showing extended collagen fibber-containing epithelial projections (arrows) pushing the healing plane forward (scale bars, 100 μm). Morpholino knockdown of nrf2 expression reduced the appearance of projections, suggesting that Nrf2a modulates the formation of collagen fibber in zebrafish. (G) Proportion of larvae forming visible projections (G; n = 14–16, Fisher test). ≈ 90 % of control larvae had visible projections, compared to only ≈ 50 % of nrf2a MO. (H) Mean ± SEM number of projections per larvae (H; n = 14–16, Two-way ANOVA, Tukey's multiple comparisons test). (I) Measurement of wound contour length in the presence or absence of nrf2a (n = 14–18 from 3 independent experiments, Two-way ANOVA with Tukey's multiple comparisons test). Nrf2a deficiency impairs tissue repair in zebrafish by affecting the formation of collagen and epithelial projections. |
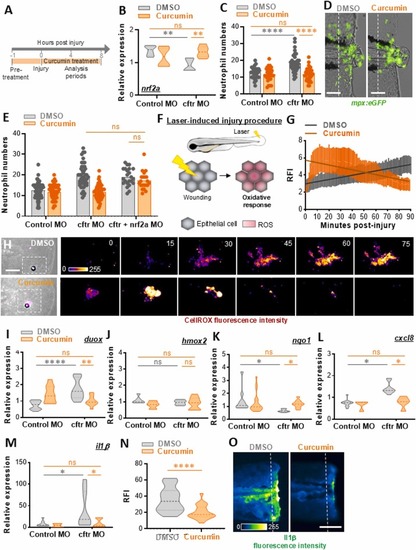
NRF2 activation by curcumin normalizes inflammation in cftr-depleted zebrafish. (A) Control MO and cftr MO were pre-treated with DMSO (as control) or curcumin before injury, then injured and immediately put back in treatments until analysis. (B) mRNA levels of nrf2a at 2 hpA (relative gene expression from at least 3 independent experiments performed in triplicates, Two-way ANOVA with Tukey's multiple comparisons test). (C) Neutrophil number at the wound at 2 hpA in control MO and cftr MO TgBAC(mpx:EGFP)i114 (3 independent experiments, Two-way ANOVA with Tukey's multiple comparisons test). (D) Representative images of amputation-induced neutrophil mobilization in cftr-MO treated or not with curcumin (scale bars, 100 μm). (E) Inhibition of nrf2a was carried out in CF animals by injecting the nrf2a morpholino. Neutrophil number at the wound at 2 hpA (3 independent experiments, Two-way ANOVA with Tukey’s multiple comparisons test). (F) Schematic illustration of laser-mediated injury assay triggering ROS production by epithelial cells. (G-H) cftr MO are stained with CellROX®, treated, laser-injured, then ROS production was time-lapse imaged and quantified over 90 minutes by confocal microscopy. (G) ROS intensity at the wound site over the time course of inflammation. Line of best fit shown is calculated by linear regression. P-value shown is for the difference between the 2 slopes (n = 12, performed as 3 independent experiments). (H) Pseudocolored imaging of laser-injured caudal fin showing representative ROS production throughout inflammation. (I-M) mRNA levels of duox, nqo1, hmox1, cxcl8 and il1β at 2 hpA (duox, cxcl8 and il1β) or 8 hpA (nqo1 and hmox1) determined by RT qPCR (relative gene expression from at least 3 independent experiments performed in triplicates, Two-way ANOVA with Tukey's multiple comparisons test). (N-O) cftr MO Tg(il1b:eGFP-F)ump3 [19] were caudal fin amputated then the expression of Il1β was observed and analyzed. Relative Il1β intensity at 2hpA in cftr MO treated or not with curcumin (n = 18 from 3 independent experiments; Mann-Whitney U test) (N) and associated pseudocolored photomicrographs of injured tails (O) revealing il1β expression at the wound-edge (scale bar, 100 μm). |
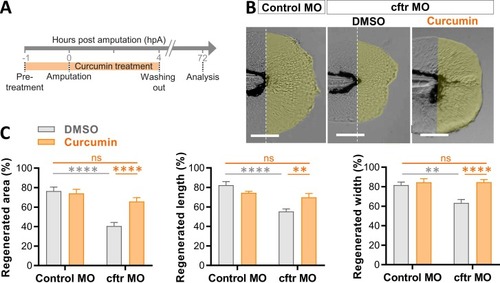
Curcumin improves defective tissue repair capacity in Cftr-depleted animals. (A-C) Control MO and cftr MO were treated with DMSO or curcumin prior to caudal fin amputation procedure, then injured and immediately put back in treatments for 4 h. The potential of tissue repair was evaluated at 72 hpA. (B) Brightfield microscopy of injured caudal fin showing tissue regeneration in cftr MO treated with curcumin versus DMSO (scale bars, 100 μm). (C) Measurement of regenerated caudal fin areas, lengths and widths following compounds exposure (n = 20, Two-way ANOVA, Tukey's multiple comparisons test). |
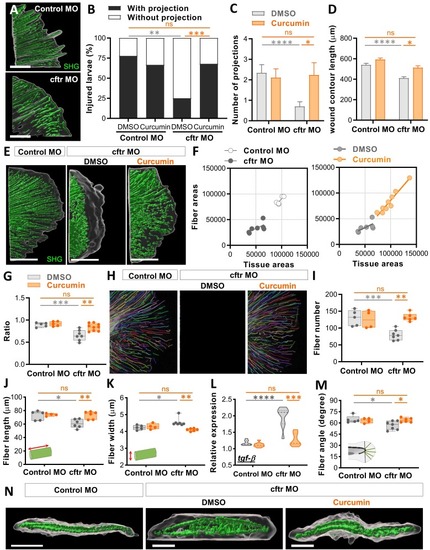
Curcumin reduces tissue damage by promoting remodeling of collagen fibers in CF zebrafish. Control MO and cftr MO were pre-treated with DMSO or curcumin prior to tail fin amputation procedure, then injured and immediately put back in treatments for 4 hrs. SHG microscopy of the regenerated tail fin was performed at 2 (A-D) or 3 dpA (E-K, M-N). (A) surface rendering of a 3D reconstruction showing tissue wound edge in the bright field and corresponding SHG imaging Z projections to reveal collagen projections in injured tails in control versus CF animals (scale bars, 25 μm). (B-C) Proportion of larvae forming projections (B; n = 18–28 Fisher test) and the number of projections per larvae (C; n = 18–28, Two-way ANOVA, Tukey's multiple comparisons test), in fishes treated or not with curcumin. (D) Measurement of wound contour length in fishes treated or not with curcumin (n = 18–28 from 3 independent experiments, Two-way ANOVA with Tukey's multiple comparisons test). (E) 3D surface-rendered reconstruction of collagen fibers in regenerated tails to illustrate the spatial organization of fibers relative to regenerated tissue with tissue wound edge in the bright field and corresponding SHG imaging Z projections (scale bars, 100 μm). (F) Areas of collagen fibers in Control MO versus cftr MO regenerated fin as a function of tissue areas (left), and areas of collagen fibers in the regenerated fin of CF fishes following DMSO or curcumin exposure as a function of tissue areas (right). (G) Graph showing the ratio of area devoid of SHG fibers (from fiber ends to wound edge) following fin amputation. Ratios were determined by measuring the areas devoid of SHG fibbers normalize with total regenerated tissue from F. (H) CT-FIRE-generated projections of SHG imaging of collagen fibers in the tail fin showing changes in organization of collagen fibers during tissue repair process. (I-K) Graphs showing quantitation of fiber number (I), length (J), width (K) as determined using the CT-FIRE fiber analysis software (3 independent experiments, Two-way ANOVA with Tukey's multiple comparisons test). (L) mRNA levels of the pro-fibrotic cytokine tgf-β at 3dpA (RT qPCR relative gene expression from at least 3 independent experiments performed in triplicates, Two-way ANOVA with Tukey's multiple comparisons test). (M) Graphs showing quantitation of fiber angle determined with the CT-FIRE fiber analysis software (3 independent experiments, Two-way ANOVA with Tukey's multiple comparisons test). (N) 3D reconstruction from fin in cross section view revealing the spatial organization between tissue and the fibers (scale bars, 100 μm), with abnormal fibbers extrusions found within the space between the 2 layers of collagen fibers. |
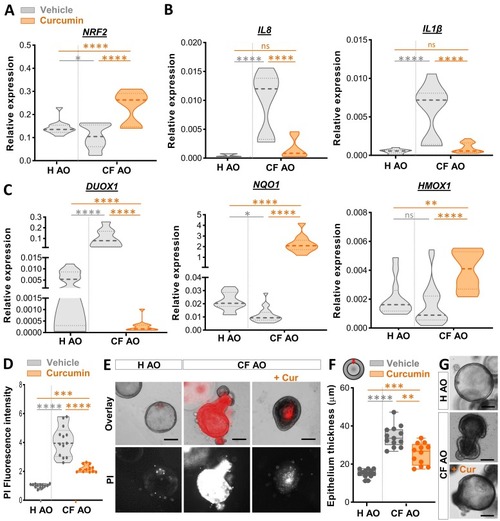
Treatment with curcumin alleviates inflammatory state and tissue damage in human CF airway organoid. (A-C) Healthy or CF airway organoids (AOs) were incubated with vehicle (DMSO) control or 30 μM curcumin for 1 day. Gene expression levels of NRF2 (A), the pro-inflammatory cytokines IL8 and IL1β (B), and the oxidative stress-related gene DUOX1 and the NRF2-activated genes NQO1 and HMOX1 (D) were determined by RT qPCR (relative gene expression from at least 3 independent experiments performed in triplicates, ANOVA with Tukey's multiple comparisons test). (D-E) Cell death analysis in AOs treated with vehicle (DMSO) control or 30 μM curcumin for 4 days. Mean fluorescence intensity quantification of the propidium iodide (PI) incorporation (D) and representative images (scale bars, 300 μm) (E) in healthy and CF-AOs treated or not with curcumin (n = 12–13, from 3 independent experiments, Two-way ANOVA with Tukey's multiple comparisons test). (F-G) Quantification of the epithelial thickness (n = 12–13, from 3 independent experiments, ANOVA with Tukey's multiple comparisons test) (F) and representative images (scale bars, 300 μm) (G) in healthy and CF-AOs treated or not with 30 µM of curcumin for 4 days. |