
|
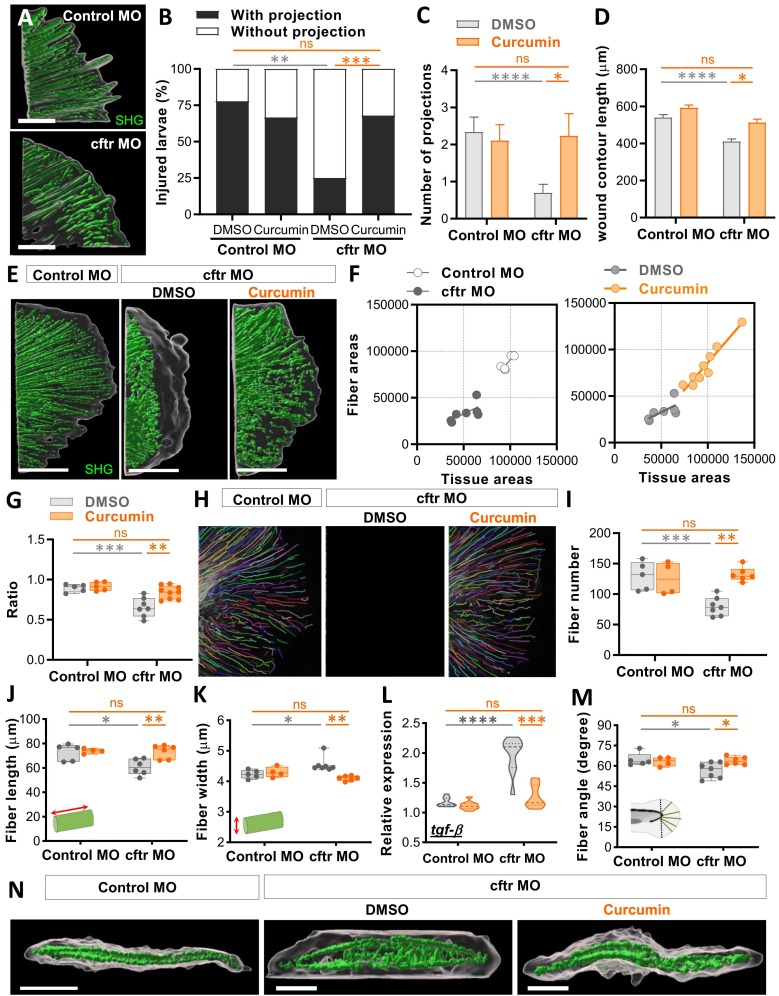
Fig. 6 Curcumin reduces tissue damage by promoting remodeling of collagen fibers in CF zebrafish. Control MO and cftr MO were pre-treated with DMSO or curcumin prior to tail fin amputation procedure, then injured and immediately put back in treatments for 4 hrs. SHG microscopy of the regenerated tail fin was performed at 2 (A-D) or 3 dpA (E-K, M-N). (A) surface rendering of a 3D reconstruction showing tissue wound edge in the bright field and corresponding SHG imaging Z projections to reveal collagen projections in injured tails in control versus CF animals (scale bars, 25 μm). (B-C) Proportion of larvae forming projections (B; n = 18–28 Fisher test) and the number of projections per larvae (C; n = 18–28, Two-way ANOVA, Tukey's multiple comparisons test), in fishes treated or not with curcumin. (D) Measurement of wound contour length in fishes treated or not with curcumin (n = 18–28 from 3 independent experiments, Two-way ANOVA with Tukey's multiple comparisons test). (E) 3D surface-rendered reconstruction of collagen fibers in regenerated tails to illustrate the spatial organization of fibers relative to regenerated tissue with tissue wound edge in the bright field and corresponding SHG imaging Z projections (scale bars, 100 μm). (F) Areas of collagen fibers in Control MO versus cftr MO regenerated fin as a function of tissue areas (left), and areas of collagen fibers in the regenerated fin of CF fishes following DMSO or curcumin exposure as a function of tissue areas (right). (G) Graph showing the ratio of area devoid of SHG fibers (from fiber ends to wound edge) following fin amputation. Ratios were determined by measuring the areas devoid of SHG fibbers normalize with total regenerated tissue from F. (H) CT-FIRE-generated projections of SHG imaging of collagen fibers in the tail fin showing changes in organization of collagen fibers during tissue repair process. (I-K) Graphs showing quantitation of fiber number (I), length (J), width (K) as determined using the CT-FIRE fiber analysis software (3 independent experiments, Two-way ANOVA with Tukey's multiple comparisons test). (L) mRNA levels of the pro-fibrotic cytokine tgf-β at 3dpA (RT qPCR relative gene expression from at least 3 independent experiments performed in triplicates, Two-way ANOVA with Tukey's multiple comparisons test). (M) Graphs showing quantitation of fiber angle determined with the CT-FIRE fiber analysis software (3 independent experiments, Two-way ANOVA with Tukey's multiple comparisons test). (N) 3D reconstruction from fin in cross section view revealing the spatial organization between tissue and the fibers (scale bars, 100 μm), with abnormal fibbers extrusions found within the space between the 2 layers of collagen fibers.