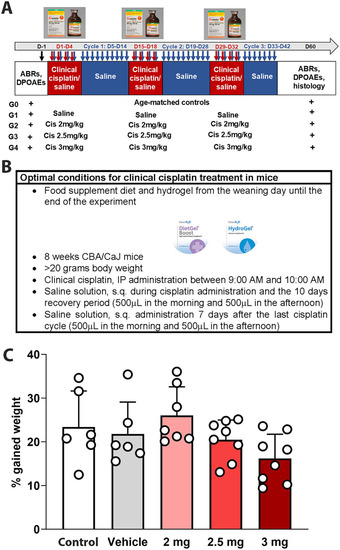
Experimental design for multi-cycle clinical cisplatin protocol. (A) Administration protocol for clinical cisplatin including the experimental groups. (B) Optimal condition for clinical cisplatin treatment. (C) Percentage of gain weight 60 days after the initiation of clinical cisplatin treatment. There were no significant differences between the treatments. Each circle represents an animal. Results are expressed as Mean +/− SD.

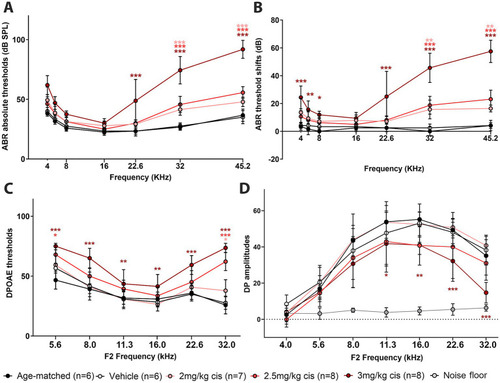
Clinical cisplatin affects hearing function in mice in a dose-dependent manner. Eight weeks old mice (>20 grams) received clinical cisplatin in a multi-cycle protocol. Hearing function was measured before and after the completion of cisplatin treatment. The following groups were tested: age-matched controls (black circles), vehicle (saline solution, white circles), clinical cisplatin at 2 mg/kg b.w. (pink circles), 2.5 mg/kg b.w (red circles) and 3 mg/kg b.w. (marron circles). (A) ABR thresholds. (B) ABR threshold shifts. (C) DPOAEs thresholds. (D) DP amplitudes. Noise floor gray circles. Results are expressed as Mean +/– SD. Statistical analysis: Two-way ANOVA followed by Dunnett post-test for multiple comparisons. *p < 0.05, **p < 0.01, and ***p < 0.001 vehicle versus the corresponding color-coded treatment. Number of animals per group is between brackets.

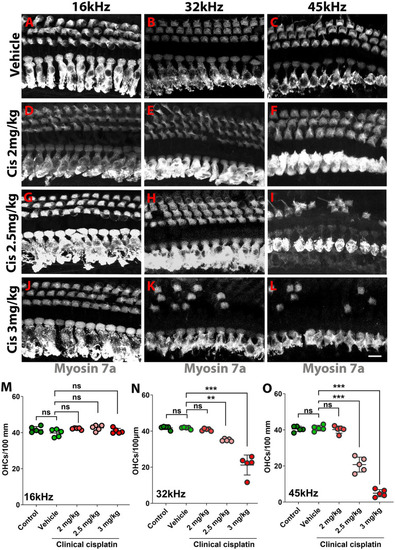
Clinical cisplatin treatment results in hair cell damage. (A–L) Representative micrographs of the organ of Corti at three frequency regions (16 kHz, 32 kHz and 45 kHz). Hair cells were immunostained for myosin-7a (gray). (A–C) Vehicle. (D–F) Clinical cisplatin 2 mg/kg b.w. (G–I) 2.5 mg/kg b.w. (J–L) 3 mg/kg b.w. Scale bar = 10 μm. (M–O) OHC quantification at 16 kHz (M), 32 kHz (N) and 45 kHz (O) regions. Mean +/− SD. Circles represent individual animals. Statistical analysis: One-way ANOVA followed by Dunnett post-test for multiple comparisons. **p < 0.01, ***p < 0.001 versus vehicle. ns, not significant.

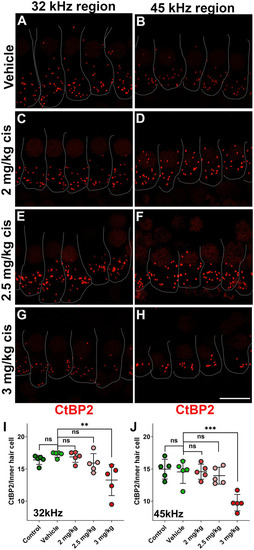
Clinical cisplatin treatment results in pre-synaptic ribbon loss at higher frequencies. (A–H) Representative micrographs of the organ of Corti at two frequency regions (32 kHz and 45 kHz). Pre-synaptic ribbons were immunostained for CtBP2 (red). Hair cells were delineated with white traces. (A,B) Vehicle. (C,D) Clinical cisplatin 2 mg/kg b.w. (E,F) 2.5 mg/kg b.w. (G,H) 3 mg/kg b.w. Scale bar = 10 μm. (I,J) pre-synaptic ribbon quantification at 32 kHz (I) and 45 kHz (J) regions. Mean +/− SD. Circles represent individual animals. Statistical analysis: One-way ANOVA followed by Dunnett post-test for multiple comparisons. **p < 0.01, ***p < 0.001 versus vehicle. ns, not significant.

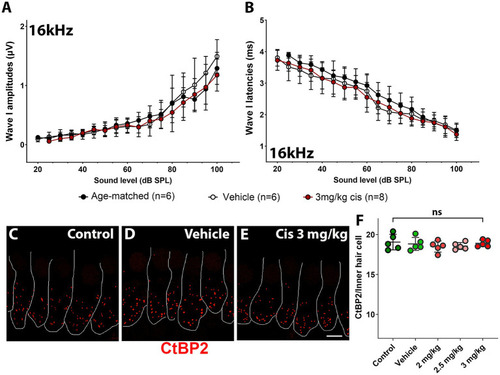
Assessment of clinical cisplatin treatment at the 16 kHz frequency region. Wave I amplitudes (A) and latencies (B) were analyzed for the 16 kHz region in age-matched control animals (black), and animals receiving saline solution (vehicle-control, white) or clinical cisplatin (3 mg/kg b.w., maroon). (C–E) Representative micrographs of the organ of Corti at the 16 kHz frequency region. Pre-synaptic ribbons were immunostained for CtBP2 (red). Hair cells were delineated with white traces. (C) Age-matched control. (D) Vehicle control. (E) Clinical cisplatin 3 mg/kg b.w. Scale bar = 5 μm. (F) Pre-synaptic ribbon quantification at the 16 kHz region for all the groups. Mean +/− SD. Circles represent individual animals. Statistical analysis: One-way ANOVA followed by Dunnett post-test for multiple comparisons. ns, not significant.

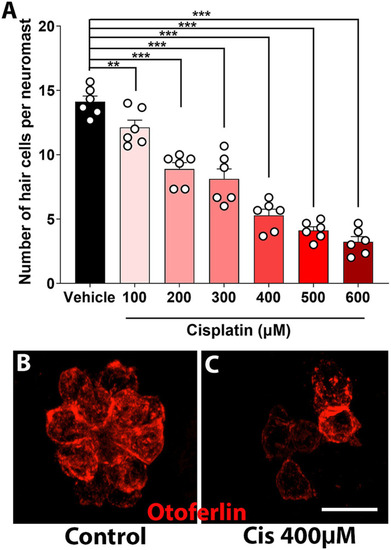
Dose–response curve of clinical cisplatin in zebrafish. (A) Quantitative data obtained from 5 to 6 dpf zebrafish treated with vehicle (saline solution) or increasing concentrations of clinical cisplatin (100 μM to 600 μM) for 6 h. Results are expressed as number of hair cells per neuromast. Mean +/− SD. Circles represent individual animals. Statistical analysis: One-way ANOVA followed by Dunnett post-test for multiple comparisons. **p < 0.01, ***p < 0.001 versus vehicle. (B,C) Representative images of a neuromast from a fish treated with vehicle (B) or clinical cisplatin at the EC50 (C, 400 μM). Hair cells were immunostained for otoferlin (red). Scale bar = 10 μm.

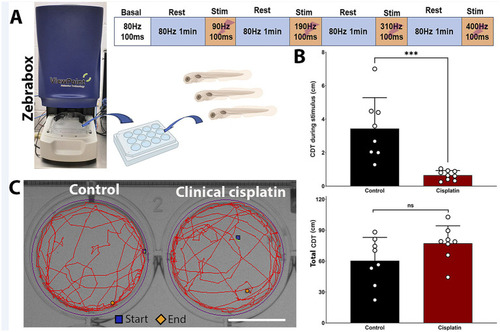
Clinical cisplatin treatment affects stimulus-dependent swimming behavior. (A) Experimental setup for the behavioral studies. (B) Cumulative distance traveled (CDT) by the zebrafish larva during the four stimulus periods (top) or over the 4 min experimental period (bottom). Results are expressed as mean +/− SD. Circles represent individual animals. Statistical analysis: Student’s t test. ***p < 0.001. (C) Track visualization of the distance covered over the 4 min period by larva treated with vehicle or clinical cisplatin. Scale bar = 1.25 cm. Biorender was used to generate part of this figure.

Acknowledgments
This image is the copyrighted work of the attributed author or publisher, and ZFIN has permission only to display this image to its users. Additional permissions should be obtained from the applicable author or publisher of the image. Full text @ Front. Cell. Neurosci.