Age-dependent myelin maintenance defects are present in dock1 MUTs. (A–C) TEM of cross-sections of ZMBs from 4-mo-old WT dock1+/+, HET dock1stl145/+, and homozygous dock1stl145/stl145 MUT zebrafish. (D–F) TEM micrographs of ZMBs from 12-mo-old WT dock1+/+, HET dock1stl145/+, and homozygous dock1stl145/stl145 MUT zebrafish, with homozygous MUTs exhibiting myelin outfoldings (red arrow). (G and H) Higher-magnification TEM micrographs of ZMBs from 12-mo-old homozygous dock1stl145/stl145 MUTs showing abnormally myelinated axons (red arrows), features rarely seen in WT dock1+/+ or HET dock1stl145/+ animals. (I) Quantification of the percent of axons with abnormal myelin profiles, observed by TEM, in WT dock1+/+ versus homozygous dock1stl145/stl145 MUTs at 4 and 12 mo old, n = 10 (WT dock1+/+ 4 mo old), 10 (dock1stl145/stl145 MUT 4 mo old), 10 (WT dock1+/+ 12 mo old), and 10 (dock1stl145/stl145 MUT 12 mo old). Here, and in all figures, the X symbol in the graph denotes a data point corresponding to the representative image shown. (A–H) Scale bar = 1 µm. (I) Two-way ANOVA with Tukey’s multiple comparisons test. ***P < 0.001; ns, not significant.

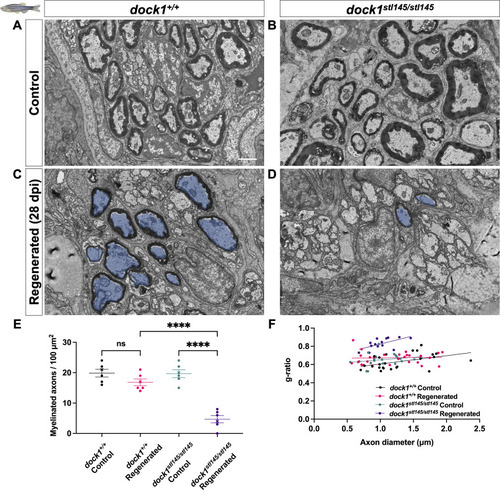
Remyelination following nerve injury is significantly reduced in dock1 MUTs. (A and B) TEM micrographs of control ZMBs from 4-mo-old WT dock1+/+ and MUT dock1stl145/stl145 zebrafish. (C and D) TEM micrographs of WT dock1+/+ and MUT dock1stl145/stl145 zebrafish showing regeneration and remyelination after transection, with remyelinated axons pseudocolored in blue. (E) Quantification of the number of myelinated axons in the ZMBs per 100 µm2, n = 6 (WT dock1+/+ control), 6 (WT dock1+/+ regenerated), 6 (dock1stl145/stl145 MUT control), and 6 (dock1stl145/stl145 MUT regenerated). (F) Quantification of the g-ratio as it relates to the axon caliber of the remyelinated axons in the regenerated ZMBs, 28 days after transection, n = 6 (WT dock1+/+ control), 6 (WT dock1+/+ regenerated), 6 (dock1stl145/stl145 MUT control), and 6 (dock1stl145/stl145 MUT regenerated). (A–D) Scale bar = 1 µm. (E) Two-way ANOVA with Tukey’s multiple comparisons test. ****P < 0.0001; ns, not significant.

SC-specific Dock1 MUTs present with multiple defects in peripheral nerves. (A) Western blot (kD) showing sciatic nerve Dock1 and β-actin protein levels from control and Dock1 cKO animals and quantification of normalized protein levels. (B and C) TEM micrographs of sciatic nerves from DhhCre+;Dock1+/+ control and littermate DhhCre+;Dock1fl/fl cKO mice at P3. (D) Quantification of the g-ratio as it relates to axon caliber, n = 6 mice, 4 images per nerve (WT); 6 mice, 4 images per nerve (cKO). (E)Dock1 cKO MUT SCs display abnormal cytoplasmic protrusions that extend in multiple directions (red arrows). (F) Trails of basal lamina found in Dock1 cKO MUTs are observed in regions devoid of SC cytoplasm (red arrowheads). (B and C) Scale bar = 4 µm. (E and F) Scale bar = 1 µm. Source data are available for this figure: SourceData F3.

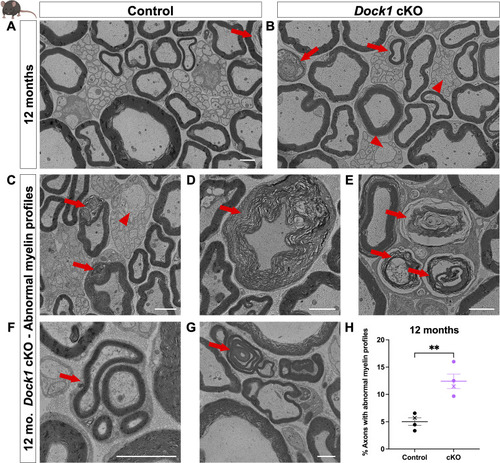
Myelin maintenance defects arise and accumulate with age in Dock1 cKO mice. (A and B) TEM micrographs of control and MUT nerves at 12 mo with MUTs containing aberrant myelin (red arrows) and Remak (red arrowheads) phenotypes. The following higher-magnification TEM micrographs are from 12-mo-old Dock1 cKO nerves: (C) Degenerating myelin (red arrows) and a large-caliber (>1 μm) axon in a Remak bundle (red arrowhead); (D) Disorganized myelin sheath (red arrow); (E) Accumulations of myelin debris and degenerating sheaths (red arrows). (F) Regeneration clusters (red arrow). (G) Myelin outfoldings and abnormal wrapping (red arrow). (H) The percentage of axons with abnormalities, n = 4 mice, 4 images per nerve (control); 4 mice, 4 images per nerve (Dock1 cKO). Here, and in all figures, the X symbol in the graph denotes a data point corresponding to the representative image shown. (A–G) Scale bar = 2 µm. (H) Unpaired t test with Welch’s correction. **P < 0.01.

Remyelination is delayed following sciatic nerve transection in Dock1 icKO mice. (A and B) TEM micrographs of sciatic nerves from control-injected (control) and tamoxifen-injected PlpCre+;Dock1fl/fl mice (icKO) 14 days after transection. Quantification reveals that icKO mice show (C) higher numbers of macrophages containing intact myelin cylinders (red arrow), (D) foamy macrophages (red arrowheads), and (E) motile macrophages (asterisks). (F) There was a trend in the icKO animals toward having fewer Bands of Büngner compared with WT; however, this was not statistically significant. (G and H) TEM micrographs of sciatic nerves from control-injected and tamoxifen-injected PlpCre+;Dock1fl/fl mice 25 days after transection. (I) Quantification of the number of remyelinated axons per 1,000 µm2, (J) g-ratio as it relates to axon caliber between control and icKO mice, (K) the number of regenerated axons >1 µm per 1,000 µm2, and (L) the number of droplets per macrophage (red arrowheads). n = 4 mice, 4 images per nerve (control); 4 mice, 4 images per nerve (icKO). Here, and in all figures, the X symbol in the graph denotes a data point corresponding to the representative image shown. (A, B, G, and H) Scale bar = 2 µm. (C–F, I, K, and L) Unpaired t test with Welch’s correction. ***P < 0.001; **P < 0.01; *P < 0.05; ns, not significant.

dock1 MUT zebrafish are sensitized to Rac1 inhibition. (A–F) Lateral views of larvae showing mbp expression by WISH in DMSO control-treated and EHT1864-treated WT dock1+/+, HET dock1stl145/+, and homozygous dock1stl145/stl145 MUT zebrafish. (A) The arrow points to strong mbp expression in the PLLn. (E and F) Arrowheads highlight decreased mbp expression in the PLLn. (G) The quantification of WISH was assessed by examining mbp expression along the entire PLLn in 4 dpf DMSO and EHT1864 zebrafish, comparing phenotypic scores and genotypes. (H–M) TEM micrographs of cross-sections of the PLLn, showing myelinated axons pseudocolored in blue, in DMSO control-treated and EHT1864-treated WT dock1+/+, HET dock1stl145/+, and homozygous dock1stl145/stl145 MUT zebrafish. (N and O) Quantifications of the total axons and myelinated axons in the PLLn. n = 6 fish per genotype (DMSO control) and 6 fish per genotype (EHT1864). Here, and in all figures, the X symbol in the graph denotes a data point corresponding to the representative image shown. (A–F) Scale bar = 100 µm. (H–M) Scale bar = 1 µm. (N and O) Two-way ANOVA with Sidak’s multiple comparisons test. **P < 0.01; *P < 0.05; ns, not significant.

Targeted genetic approaches reveal an interaction between Dock1 and Rac1 in the developing PNS. (A–I) TEM micrographs of cross-sections of the PLLn, showing myelinated axons pseudocolored in blue, in control (Cas9 only), sgRac1+Cas9, and sgRac3+Cas9 in WT dock1+/+, HET dock1stl145/+, and homozygous dock1stl145/stl145 MUT zebrafish. (J) Quantification of myelinated axons in the PLLn. n = 6 fish per genotype and experimental condition. (K) Western blot showing sciatic nerve active and total Rac1 protein levels from control and Dock1 cKO animals, along with quantification of protein levels. Representative blot consisting of 12 nerves from 6 animals per genotype. Here, and in all figures, the X symbol in the graph denotes a data point corresponding to the representative image shown. (A–I) Scale bar = 100 µm. (J) Two-way ANOVA with Sidak’s multiple comparisons test. ***P < 0.001; *P < 0.05; ****P < 0.0001; ns, not significant. Source data are available for this figure: SourceData F7.

dock1 MUT zebrafish do not exhibit myelin defects at 4 mo. (A–D) Quantifications of the total number of axons, the number of myelinated axons, the number of SC nuclei, and g-ratio were obtained from analyzing TEM micrographs (see Fig. 1). None of these analyses revealed significant differences between WT, HET, or homozygous MUT zebrafish. n = 6 fish per genotype. (A–C) One-way ANOVA with Brown–Forsythe test.

Adult dock1 MUT zebrafish-regenerated barbels are grossly indistinguishable from WT. (A–D) Maxillary barbels from uninjured 4-mo-old WT and dock1 MUT zebrafish (A and B) taken from the same fish and at the same time as 28-day regenerated control and dock1 MUTs (C and D) were harvested. (E–G) Quantifications from TEM micrographs (see Fig. 2) found no significant differences between genetic and experimental groups in the number of SC nuclei, total axon count, or axon size. n = 6 fish per genotype. (A–D) Scale bar = 1 mm. (E–G) One-way ANOVA with Brown–Forsythe test.

The myelin phenotype observed in Dock1 MUTs at P3 resolves by P28. (A–C) Quantifications obtained from analyzing P3 TEM micrographs showing the number of SC nuclei, the total number of axons, and the number of myelinated axons (see Fig. 3). None of these analyses revealed significant differences between control and cKO mice at P3. (D and E) TEM micrographs of control and Dock1 cKO sciatic nerves at P28. (F and G) Quantifications of myelinated axon count and g-ratios obtained from P28 TEM micrographs reveal no significant differences. n = 6 animals per genotype. (D and E) Scale bar = 4 µm. (A–C and F) Unpaired t test with Welch’s correction. ns, not significant.

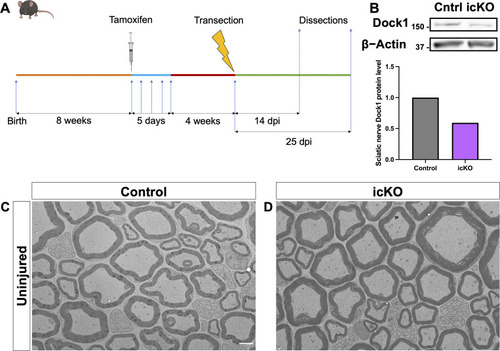
An inducible SC-specific Dock1 MUT mouse to study SC repair. (A) Schematic representation showing the experimental timeline for sciatic nerve injury studies using the icKO mice. (B) Western blot showing sciatic nerve Dock1 and β-actin protein levels from control and Dock1 icKO animals and quantification of normalized protein levels. (C and D) TEM micrographs of sciatic nerves from control-injected and tamoxifen-injected PlpCre+;Dock1fl/fl mice before injury. (C and D) Scale bar = 2 µm. Source data are available for this figure: SourceData FS4.

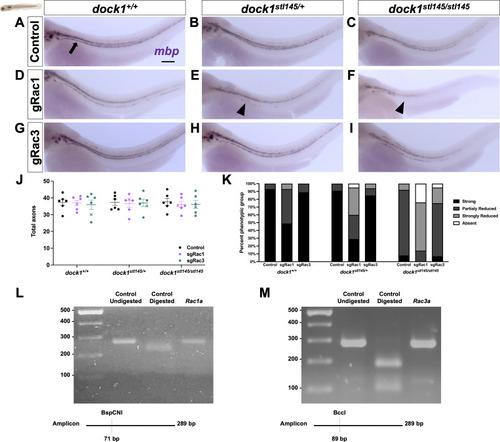
WISH reveals an interaction between Dock1 and Rac1 in the developing zebrafish PNS. (A–I) Lateral views of larvae showing mbp expression by WISH in control, sgRac1+Cas9, and sgRac3+Cas9 in WT dock1+/+, HET dock1stl145/+, and homozygous dock1stl145/stl145 MUT zebrafish. (A) The arrow points to strong mbp expression in the PLLn. (E and F) Arrowheads highlight decreased mbp expression in the PLLn. (J) Quantification of TEM of total axons in the PLLn. n = 6 fish per genotype and experimental condition. (K) The quantification of WISH was assessed by examining mbp expression along the entire PLLn in 4 dpf control, sgRac1+Cas9, and sgRac3+Cas9 in WT dock1+/+, HET dock1stl145/+, and homozygous dock1stl145/stl145 MUT zebrafish, compared between phenotypic scores and genotypes. (L and M) Gels and schematics of the PCR and restriction digest validation of sgRac1 and sgRac3, respectively. Here, and in all figures, the X symbol in the graph denotes a data point corresponding to the representative image shown. (A–I) Scale bar = 100 µm. Source data are available for this figure: SourceData FS5.

Acknowledgments
This image is the copyrighted work of the attributed author or publisher, and ZFIN has permission only to display this image to its users. Additional permissions should be obtained from the applicable author or publisher of the image. Full text @ J. Cell Biol.