
- Title
-
Compensatory lymphangiogenesis is required for edema resolution in zebrafish
- Authors
- Olayinka, O., Ryu, H., Wang, X., Malik, A.B., Jung, H.M.
- Source
- Full text @ Sci. Rep.

Zebrafish model of edema formation. (A) Schematic showing the experimental workflow from osmotic stress induction to edema formation and resolution. (B) Percentage of edematous larvae in osmotically balanced and osmotically imbalanced conditions at 4 dpf. Individual data points represent an independent experiment, and 20 larvae were used for each experiment. (C) Representative brightfield images showing lateral views of osmotically balanced (top) and osmotically imbalanced (bottom) 4 dpf zebrafish larvae. The dotted outline illustrates the boundary for edema area quantification in different parts of the body. Casper fish were used for imaging. (D–G) Quantification of pericardial area (D), yolk area (E), trunk area (F), and (G) head area. (H) Representative brightfield images showing the dorsal view of osmotically balanced (left) and osmotically imbalanced (right) zebrafish larvae. Red arrows indicate edema in the lateral side of the yolk area. (I) Representative images of osmotic balance (OB), edema-free (EF), and persistent-edema (PE) larva at 8 dpf. Casper fish were used for imaging. (J) Quantitative analysis of the pericardium and gut areas. Each dot represents an individual larva. (K) Line graph showing edema progression from 4–6 dpf. Each line represents the progressive change in the pericardial + yolk sac surface area of individual larvae over the experiment time course. The blue line is the larva raised in an osmotically balanced solution as a control. Scale bar = 500 μm (C,H,I). ns, not significant; *p < 0.05; ****p < 0.0001. |
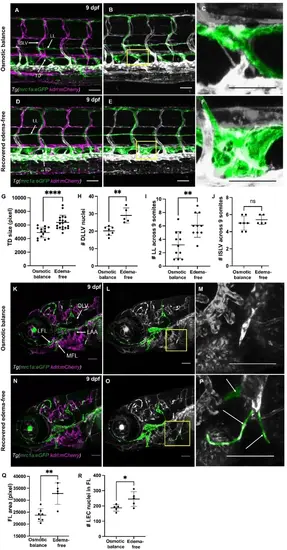
Lymphatic vessel expansion during edema recovery. (A) Confocal image of osmotically balanced Tg(mrc1a:egfp; kdrl:mcherry) larvae illustrating the normal vascular network at 9 dpf. (B) Lymphatic vessels are pseudo-colored in green from panel (A) (C) Magnified image of the thoracic duct in panel (B) (D) Confocal image of recovered edema-free Tg(mrc1a:egfp; kdrl:mcherry) larvae illustrating the vascular network following edema resolution. (E) Lymphatic vessels are pseudo-colored in green from panel D, highlighting the excess lateral lymphatics and dilated thoracic duct. (F) Magnified image of the thoracic duct in panel E. (G) Quantification of the thoracic duct surface area in controls (n = 14) and edema-resolved larvae (n = 19). (H) Quantification of the number of DLLV nuclei in controls (n = 7) and edema-free larvae (n = 5) in Tg(fli1a:nEGFP; lyve1b:dsRed) background. (I) Comparison of the number of LL segments in 9 somites between controls (n = 11) and edema-free larvae (n = 10). (J) Quantification of the number of intersegmental lymphatic vessels in controls (n = 7) and edema-free larvae (n = 5). (K) Confocal image of the facial lymphatics of osmotically balanced larvae at 9 dpf. (L) Lymphatic vessels are pseudo-colored in green from panel K. (M) Magnified image from panel L. (N) Confocal image of the facial lymphatics of recovered edema-free larvae at 9 dpf. (O) Lymphatic vessels are pseudo-colored in green from panel N. (P) Magnified image from panel O showing excessive lymphatic sprouts. (Q) Comparison of the total facial lymphatic area in controls (n = 7) and edema-free larvae (n = 5). (R) Number of facial LEC nuclei in controls (n = 5) and edema-free larvae (n = 5). Tg(fli1a:nEGFP; lyve1b:dsRed) was used for quantitation. Scale bar = 50 μm (A-L). *p < 0.05, **p < 0.01; ****p < 0.0001. |

Lymphatic endothelial cell proliferation and elongation during edema recovery. (A) Schematic illustrating the imaging area of trunk lymphatics. (B) Diagram of developmental steps of lymphatic progenitors that give rise to lymphatic vessels at 3–4 dpf. (C) Confocal image of osmotically balanced Tg(mrc1a:egfp; kdrl:mcherry) larvae showing normal vascular network at 4 dpf. (D) Pseudo-colored confocal micrograph of untreated transgenic larvae indicating the parachordal lymphangioblasts (PLs) in green and other vessels in grayscale. (E) Magnified image of the PLs in panel D. (F) Confocal image of osmotically imbalanced Tg(mrc1a:egfp; kdrl:mcherry) larvae showing the vascular phenotype in edema state. (G) Pseudo-colored confocal micrograph of osmotically imbalanced larvae highlighting the excess PLs during edema. (H) Magnified image of PL in panel F. (I) Quantification of the somites containing PLs. 9 somites per larvae were counted (n = 13 embryos each). (J) Comparison of the number of somites with TD fragments during edema formation at 4 dpf (n = 9 embryos each). (K) Confocal image of trunk vessels of an osmotically balanced Tg(fli1:nEGFP; lyve1b:dsRed) double transgenic larva. (L) Magnified image of the thoracic duct illustrating the oval-shaped LEC nuclei in panel K. The dotted lines indicate the boundary of the thoracic duct, and the arrows indicate LECs on the thoracic duct. (M) Confocal image of trunk vessels of a recovered edema-free Tg(fli1:nEGFP; lyve1b:dsRed) larva. (N) Magnified image of the thoracic duct highlighting the elongated LEC nuclei (arrow) in panel M. (O) Quantification of LECs in the thoracic duct of 9 somites between osmotic balanced (n = 10) and edema-free larvae (n = 13). (P) Quantification of BECs in the PCV across 9 somites between osmotic balanced (n = 11) and edema-free larvae (n = 13) (Q) Quantification of lymphatic or blood endothelial nuclei length in osmotically balanced or edema-resolved larvae. A total of 30 nuclei were counted from each group. Scale bar = 50 μm (A-H and J-M). ns, not significant; ***p < 0.001, ****p < 0.0001. |
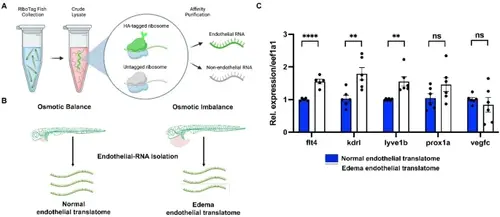
Endothelial translatome analysis reveals upregulation of lymphangiogenic factors in edematous vessels. (A) Schematic of the experimental flow of translating ribosome affinity purification (TRAP) protocol to isolate endothelial and non-endothelial translatome. (B) The experimental design to analyze endothelial translatome from osmotically balanced and imbalanced edematous Ribotag transgenic fish using TRAP assay. (C) Comparison of the translatome analysis of key lymphatic genes in osmotically balanced and imbalanced edematous larvae. Each RNA sample was obtained from a pool of at least 350 embryos. ns, not significant; **p < 0.01; ****p < 0.0001. |
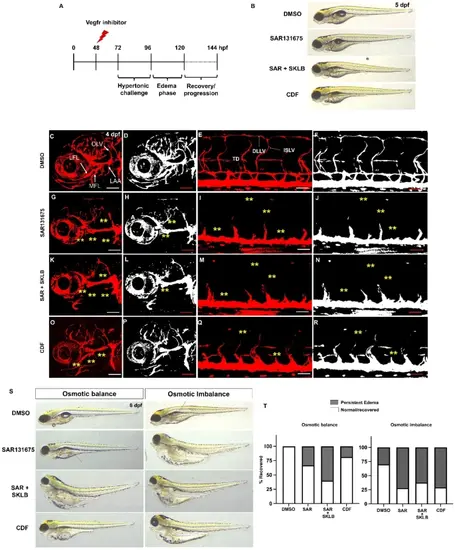
Vegfr-dependent lymphangiogenic program is required for edema fluid clearance. (A) Schematic diagram illustrating the experimental design for Vegfr inhibition during the osmotic challenge and edema progression. (B) Representative brightfield images showing edema formation in 5 dpf larvae treated with DMSO, 10 µM SAR131675, SAR131675 and 5µM SKLB1002 combined, 2.5 µM CDF in osmotically balanced conditions. (C) Confocal image of craniofacial vessels of a DMSO-treated Tg(lyve1b:dsRed) larva raised in an osmotically balanced condition. (D) Grayscale confocal micrograph of a DMSO-treated larva highlighting the facial lymphatics. (E) Confocal image of trunk vessels of a DMSO-treated Tg(lyve1b:dsRed) larva raised in an osmotically balanced condition. (F) Grayscale confocal micrograph of a DMSO-treated larva highlighting the thoracic duct. (G) Confocal image of craniofacial vessels of a SAR131675-treated Tg(lyve1b:dsRed) larva showing absence of facial lymphatics. (H) Grayscale confocal micrograph of a SAR131675-treated larva highlighting the complete loss of facial lymphatics (I) Confocal image of trunk vessels of a SAR131675-treated Tg(lyve1b:dsRed) larva showing complete absence of thoracic duct. (J) Grayscale confocal micrograph of a SAR131675-treated larva highlighting the loss of thoracic duct. (K) Confocal image of craniofacial vessels of a SAR131675 and SKLB1002 -treated Tg(lyve1b:dsRed) larva showing absence of facial lymphatics. (L) Grayscale confocal micrograph of a SAR131675 and SKLB1002-treated larva highlighting the loss of facial lymphatics (M) Confocal image of trunk vessels of a SAR131675 and SKLB1002 -treated Tg(lyve1b:dsRed) larva showing complete absence of thoracic duct. (N) Grayscale confocal micrograph of a SAR131675 and SKLB1002 -treated larva highlighting the loss of thoracic duct. (O) Confocal image of craniofacial vessels of a CDF-treated Tg(lyve1b:dsRed) larva showing partial absence of facial lymphatics. (P) Grayscale confocal micrograph of CDF-treated larva highlighting the partial loss of facial lymphatics (Q) Confocal image of trunk vessels of CDF-treated Tg(lyve1b:dsRed) larva showing significant disruption of thoracic duct development. (R) Grayscale confocal micrograph of CDF-treated larva highlighting the loss of thoracic duct. (S) Representative brightfield images showing edema outcomes in 6 dpf larvae treated with DMSO, SAR131675, SAR131675 and SKLB1002 combined, or CDF in osmotically balanced or imbalanced conditions. (T) The percentage of edema recovery demonstrated by the ratio of larvae recovered from edema or developed persistent edema at 8 dpf under DMSO and inhibitor treatments in osmotic balance and osmotic imbalance conditions. LFL, Lateral facial lymphatics; MFL, Medial facial lymphatics; LAA, Lymphatic brachial arches; OLV, Otholitic lymphatic vessels. Yellow asterisks indicate missing lymphatic structures in panels F-M. Scale bars = 500 μm (B), 50 μm (C-R). |