
|
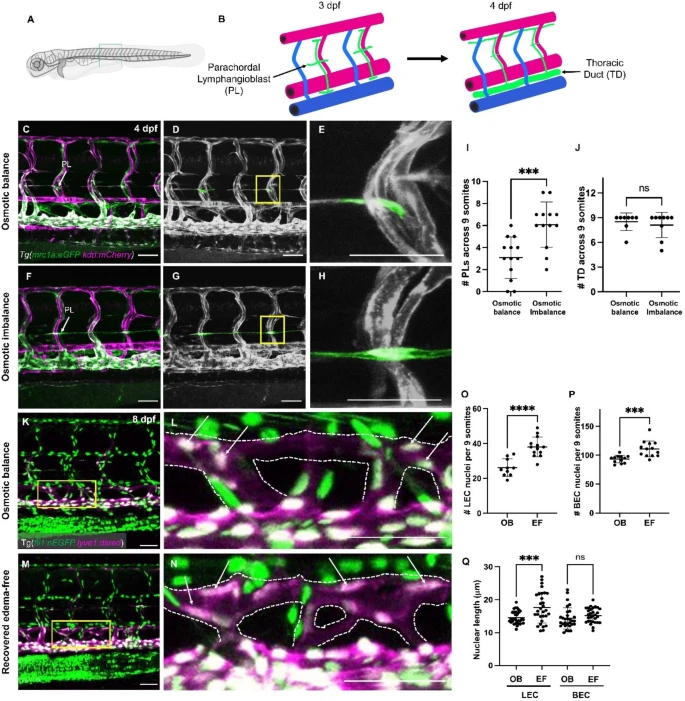
Fig. 3 Lymphatic endothelial cell proliferation and elongation during edema recovery. (A) Schematic illustrating the imaging area of trunk lymphatics. (B) Diagram of developmental steps of lymphatic progenitors that give rise to lymphatic vessels at 3–4 dpf. (C) Confocal image of osmotically balanced Tg(mrc1a:egfp; kdrl:mcherry) larvae showing normal vascular network at 4 dpf. (D) Pseudo-colored confocal micrograph of untreated transgenic larvae indicating the parachordal lymphangioblasts (PLs) in green and other vessels in grayscale. (E) Magnified image of the PLs in panel D. (F) Confocal image of osmotically imbalanced Tg(mrc1a:egfp; kdrl:mcherry) larvae showing the vascular phenotype in edema state. (G) Pseudo-colored confocal micrograph of osmotically imbalanced larvae highlighting the excess PLs during edema. (H) Magnified image of PL in panel F. (I) Quantification of the somites containing PLs. 9 somites per larvae were counted (n = 13 embryos each). (J) Comparison of the number of somites with TD fragments during edema formation at 4 dpf (n = 9 embryos each). (K) Confocal image of trunk vessels of an osmotically balanced Tg(fli1:nEGFP; lyve1b:dsRed) double transgenic larva. (L) Magnified image of the thoracic duct illustrating the oval-shaped LEC nuclei in panel K. The dotted lines indicate the boundary of the thoracic duct, and the arrows indicate LECs on the thoracic duct. (M) Confocal image of trunk vessels of a recovered edema-free Tg(fli1:nEGFP; lyve1b:dsRed) larva. (N) Magnified image of the thoracic duct highlighting the elongated LEC nuclei (arrow) in panel M. (O) Quantification of LECs in the thoracic duct of 9 somites between osmotic balanced (n = 10) and edema-free larvae (n = 13). (P) Quantification of BECs in the PCV across 9 somites between osmotic balanced (n = 11) and edema-free larvae (n = 13) (Q) Quantification of lymphatic or blood endothelial nuclei length in osmotically balanced or edema-resolved larvae. A total of 30 nuclei were counted from each group. Scale bar = 50 μm (A-H and J-M). ns, not significant; ***p < 0.001, ****p < 0.0001.