FIGURE SUMMARY
Title

Metallothionein II treatment mitigates rotenone-induced neurodegeneration in zebrafish models of Parkinson's disease

Authors
Nies, Y.H., Lim, W.L., Abd Karim, N., Yahaya, M.F., Teoh, S.L.
Source
Full text @ Front Pharmacol

Experimental design of animal groups and treatment timeline. Fish were divided into 4 groups (n = 15 per group), namely, control (CTRL), rotenone-treated PD model (ROT), hMT2 pretreatment (hMT2-ROT), and hMT2 co-treatment (ROT-hMT2) groups. PD was induced in zebrafish using 5 μg/L rotenone water for 28 days. hMT2 was intracranially injected a day before (hMT2-ROT) or 7 days after (ROT-hMT2) the rotenone exposure.

Effects of rotenone on locomotor activity of adult zebrafish. (A) Locomotor analysis measured the total distance traveled for 5 min in a novel tank. (B) Total time of the experimental fish explored the upper and lower zones of the tank. (C) Representative computerized video tracking of zebrafish’s path in the novel tank over 5 min. *p < 0.05, **p < 0.001 vs. CTRL; #p < 0.05, ##p < 0.001 vs. ROT (n = 6 per group).

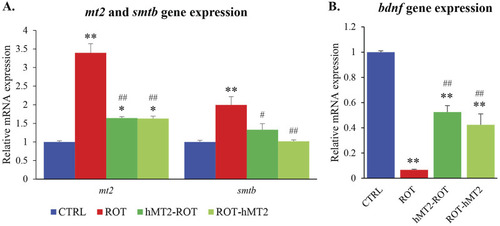
Effects of rotenone and hMT2 on metallothioniein and bdnf gene expression. Bar graph presentation of the fold change of (A)mt2 and smtb, and (B)bdnf quantified by qPCR. All qPCR results are normalized to reference gene β-actin, and expressed as changes from the respective CTRL group. *p < 0.05, **p < 0.001 vs. CTRL; #p < 0.05, ##p < 0.001 vs. ROT (n = 6 per group).

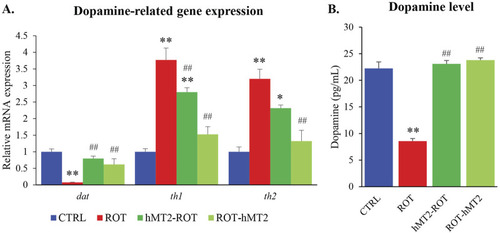
Effects of rotenone and hMT2 on dopamine-related genes expression and dopamine levels. (A) Bar graph presentation of the fold change of dat, th1 and th2 quantified by qPCR. All qPCR results are normalized to reference gene β-actin, and expressed as changes from the respective CTRL group. (B) Dopamine levels (pg/mL) of the groups. *p < 0.05, **p < 0.001 vs. CTRL; #p < 0.05, ##p < 0.001 vs. ROT (n = 6 per group).

Effects of rotenone and hMT2 on brain inflammation. (A) Bar graph presentation of the fold change of il1a, il1b, cox2 and tnfa quantified by qPCR. All qPCR results are normalized to reference gene β-actin, and expressed as changes from the respective CTRL group. (B) Lipid peroxidation (MDA, µM) of the groups. *p < 0.05, **p < 0.001 vs. CTRL; #p < 0.05, ##p < 0.001 vs. ROT (n = 6 per group).

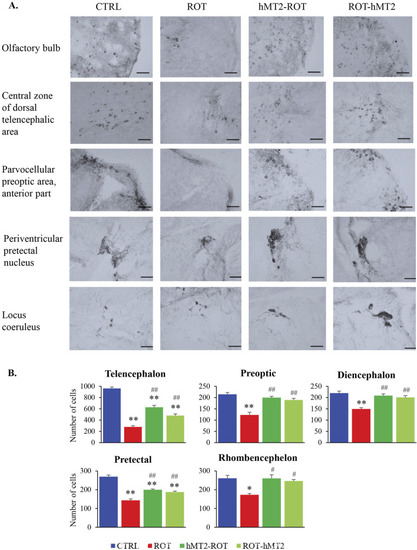
Effects of rotenone and hMT2 on dopaminergic neuron population. (A) Representative light micrographs of brain regions in CTRL, ROT, hMT2-ROT and ROT-hMT2 groups using tyrosine hydroxylase (TH) immunohistochemical staining. Scale bars = 50 μm. (B) Quantification dopaminergic neurons (TH + cells) within the zebrafish brain regions in CTRL, ROT, hMT2-ROT and ROT-hMT2 groups. *p < 0.05, **p < 0.001 vs. CTRL; #p < 0.05, ##p < 0.001 vs. ROT (n = 3 per group).

Effects of rotenone and hMT2 on mitochondria function. Representative phenetic maps of CTRL, ROT, hMT2-ROT and ROT-hMT2 mitochondria in the presence of mitochondria-centered drugs for 6 h, generated after normalization of the optical density values of each drug concentration at 590 nm (purple color) to those of the positive-control wells included in the MitoPlate™ I-1 plates. #p < 0.05, ##p < 0.001 vs. ROT (n = 3 per group).

Effects of rotenone and hMT2 on dye reduction kinetics in mitochondria with complex II inhibitors (malonate and carboxin) and meclizine. The graphs showed representative reduction dynamics of the dye over time measured as absorbance at 590 nm for 6 h at 5-min intervals. ROT group exhibited significantly slower dye reduction, indicating mitochondrial dysfunction. Both hMT2-ROT and ROT-hMT2 groups showed improved dye reduction rates compared to ROT, suggesting restored mitochondrial function.

Acknowledgments
This image is the copyrighted work of the attributed author or publisher, and ZFIN has permission only to display this image to its users. Additional permissions should be obtained from the applicable author or publisher of the image. Full text @ Front Pharmacol