IMAGE

FIGURE 6

ID
ZDB-IMAGE-250218-14
Source
Figures for Nies et al., 2025
Image
Figure Caption

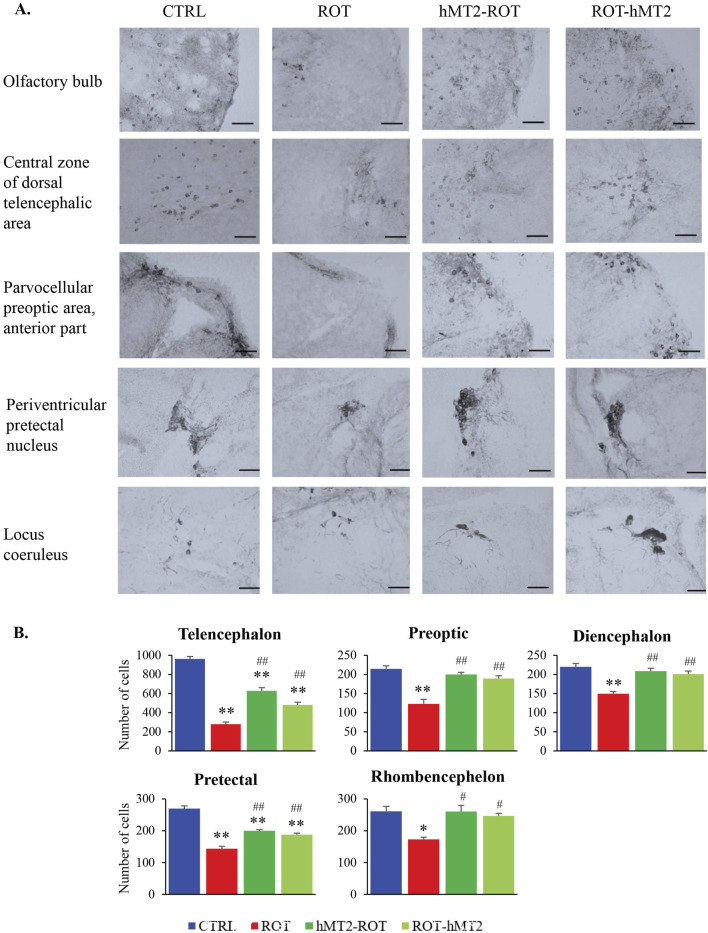
FIGURE 6

Effects of rotenone and hMT2 on dopaminergic neuron population. (A) Representative light micrographs of brain regions in CTRL, ROT, hMT2-ROT and ROT-hMT2 groups using tyrosine hydroxylase (TH) immunohistochemical staining. Scale bars = 50 μm. (B) Quantification dopaminergic neurons (TH + cells) within the zebrafish brain regions in CTRL, ROT, hMT2-ROT and ROT-hMT2 groups. *p < 0.05, **p < 0.001 vs. CTRL; #p < 0.05, ##p < 0.001 vs. ROT (n = 3 per group).

Acknowledgments
This image is the copyrighted work of the attributed author or publisher, and ZFIN has permission only to display this image to its users. Additional permissions should be obtained from the applicable author or publisher of the image. Full text @ Front Pharmacol