
- Title
-
Imaging analytical technique to assess gastrointestinal motility in vivo using zebrafish larvae with diabetes mellitus-like traits
- Authors
- Hui, J.C.M., Du, P., Webb, S.E., Liu, J.Y.H., Ngan, M.P., Lu, Z., Ng, H.S.H., Yang, L., Khalid, A., Liu, L., Li, Z., Deng, Y., Cui, D., Rudd, J.A.
- Source
- Full text @ PLoS One
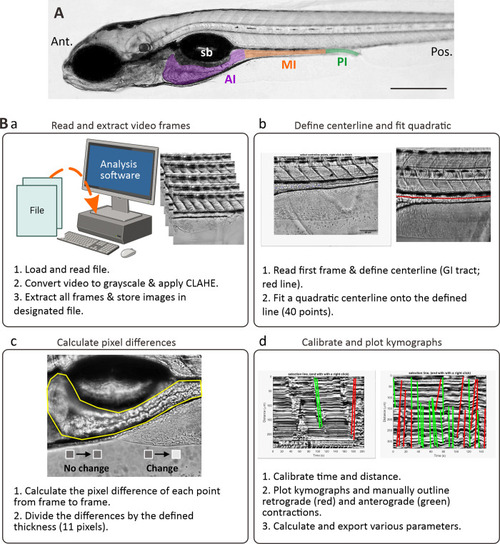
The kymography protocol. (A) Bright-field image of a lateral view of a zebrafish larva at 7 dpf showing the anterior intestine (AI, purple), mid-intestine (MI, orange) and posterior intestine (PI; green). Sb is swim bladder. Ant. And Pos. are anterior and posterior, respectively. Scale bar: 200 μm. (B) Schematic to demonstrate the four main steps (Ba-Bd) used to analyse the imaging data via kymography. In (Bd), the green and red lines are indications of contractions in the anterograde and retrograde direction, respectively. There were drawn using line tools available in MATLAB (R2018b, MathWorks, Natick, MA, USA). |

Measurements of body mass index (BMI) and adipose deposits. (A) Box plots showing the (Aa) BMI (in mg/mm2, n = 21) and (Ab) area of adipose deposits (in mm2, n = 10) measured in zebrafish larvae from 5 dpf to 7 dpf. Both plots show larvae fed a standard diet (SD, controls), or those fed an excess diet (ED), a high-fat diet (HFD), or an SD with immersion in glucose solution at 30 mmol/L (SDG). Medians are shown by horizontal lines inside the boxes, the 25th and 75th percentiles are shown as the bottom and tops of the boxes, and the minimum and maximum values are shown as the small horizontal lines below and above the boxes, and mean values are indicated as “+” sign. Significant differences relative to the SD controls are shown as * |

Quantification of fasting glucose, random glucose, and insulin levels. (A) Box plots showing (Aa,b) the amount of glucose (in μM) following the (Aa) fasting or (Ab) random glucose assay, and (Ac) the amount of insulin (in μl/ml), in larvae fed with the standard controls (SD), excess diet (ED), high fat diet (HFD) or SD + glucose diet (SDG), at 5 dpf, 6 dpf or 7 dpf. All the assays were repeated 9 times with n = 10 larvae each time. Medians are shown by horizontal lines inside the boxes, the 25th and 75th percentiles are shown as the bottom and tops of the boxes, and the minimum and maximum values are shown as the small horizontal lines below and above the boxes, and mean values are indicated as “+” sign. Significant differences relative to the SD controls are shown as * |

Measuring gut motility using kymography. (A,C,E) Representative bright-field images showing the (A) anterior, (C) mid and (E) posterior regions of the intestine of SD controls larvae at 7 dpf, and (B,D,F) their respective kymographs. Green and red arrows (in A, C, and E) and lines (in B, D, and F) indicate anterograde and retrograde contractile activity, respectively, and the yellow rectangle (in F) indicates the rectal waves. Scale bars are 50 μm (A,C,E) and 40 μm over 50 s (B,D,F). |

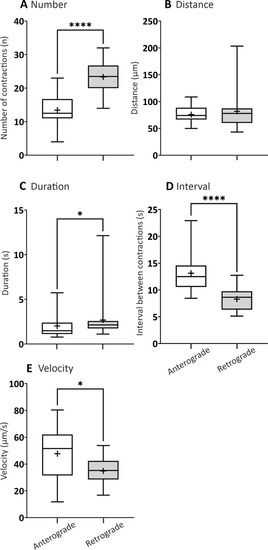
Box plots to show various parameters of GI motility determined from AB larvae at 7 dpf that were fed a standard diet (SD). The following parameters were determined by kymography analysis: (A) number, (B) distance (μm), and (C) duration (s) of contractions, (D) interval between contractions (s), and (E) contraction velocity (μm/s), in both the anterograde and retrograde direction. Medians are shown by horizontal lines inside the boxes, the 25th and 75th percentiles are shown as the bottom and tops of the boxes, and the minimum and maximum values are shown as the small horizontal lines below and above the boxes, and mean values are indicated as “+” sign. Significant differences were determined by two-way ANOVA followed by the Tukey/Sidak multiple comparison test and are presented as * |
Box plots to show various parameters of the rectal waves generated in AB larvae at 7 dpf that were fed a standard diet (SD). The following parameters were determined by kymography analysis: (A) number, (B) distance (μm) and (C) duration (s) of contractions, (D) interval between contractions (s), and (E) contraction velocity (μm/s). These parameters were determined in both the anterograde and retrograde direction. Medians are shown by horizontal lines inside the boxes, the 25th and 75th percentiles are shown as the bottom and tops of the boxes, and the minimum and maximum values are shown as the small horizontal lines below and above the boxes, and mean values are indicated as “+” sign. Significant differences between the anterograde and retrograde actions were determined by the unpaired nonparametric Mann Whitney U test and are presented as * |

Box plots to show various parameters of GI motility in the anterior, mid, and posterior intestine of ED, HFD and SDG larvae compared with the SD controls, at 7 dpf. The following parameters were determined by kymography analysis: (A) number, (B) distance (μm), and (C) duration (s) of contractions, in both the anterograde and retrograde direction. Medians are shown by horizontal lines inside the boxes, the 25th and 75th percentiles are shown as the bottom and tops of the boxes, and the minimum and maximum values are shown as the small horizontal lines below and above the boxes, and mean values are indicated as “+” sign. Significant differences were determined by two-way ANOVA followed by the Sidak multiple comparison test and are presented as * |

Box plots to show various parameters of GI motility in the anterior, mid, and posterior intestine of ED, HFD and SDG larvae compared with the SD controls, at 7 dpf. The (A) interval (s) and (B) velocity (μm/s) of contractions were determined in both the anterograde and retrograde direction by kymography analysis. Medians are shown by horizontal lines inside the boxes, the 25th and 75th percentiles are shown as the bottom and tops of the boxes, and the minimum and maximum values are shown as the small horizontal lines below and above the boxes, and mean values are indicated as “+” sign. Significant differences were determined by two-way ANOVA followed by the Sidak multiple comparison test and are presented as * |

Box plots to show various parameters of the rectal waves ED, HFD and SDG larvae compared with the SD controls, at 7 dpf. The (A) number, (B) distance (μm), and (C) duration (s) of contractions, (D) interval between contractions(s), and (E) contraction velocity (μm/s) were determined in both the anterograde and retrograde direction by kymography analysis. Medians are shown by horizontal lines inside the boxes, the 25th and 75th percentiles are shown as the bottom and tops of the boxes, and the minimum and maximum values are shown as the small horizontal lines below and above the boxes, and mean values are indicated as “+” sign. Significant differences were determined by two-way ANOVA followed by the Sidak multiple comparison test and are presented as * |

Graphs showing the qPCR data from SD, ED, HFD and SDG larvae at 7 dpf (n = 6 for each). The in heatmap (A) and boxplots (B) data for each gene were normalised and expressed as the relative fold expression compared to |