
- Title
-
Tunneling nanotubes enable intercellular transfer in zebrafish embryos
- Authors
- Korenkova, O., Liu, S., Prlesi, I., Pepe, A., Albadri, S., Del Bene, F., Zurzolo, C.
- Source
- Full text @ Dev. Cell
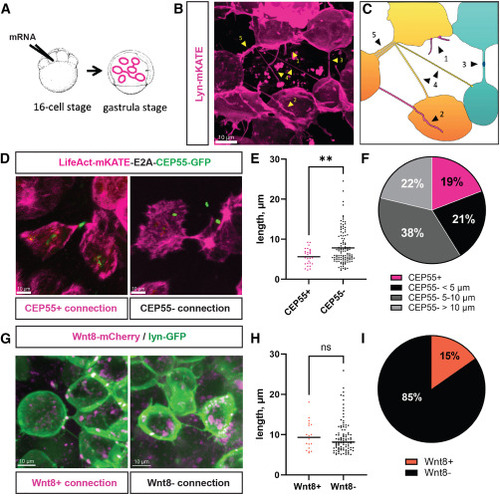
Characterization of intercellular connections in zebrafish gastrula (A) Schematic representation of the labeling strategy to visualize intercellular connections: zebrafish embryo is injected into one of the central cells at the 16-cell stage, incubated at 28°C until it reaches the gastrula stage (7–9 hpf), and mounted for imaging. (B) Fluorescent photograph of different protrusions that can be observed at the gastrula stage following membrane labeling by lyn-mKATE mRNA injection, identified by yellow arrowheads: (1) short protrusions, (2) long closed-ended protrusions, (3) connections with interrupted membrane labeling, (4) thin TNT-like structures, and (5) thick TNT-like structures. (C) Cartoon representing the image (B), suggesting the coexistence of (1) filopodia, (2) cytonemes, (3) cytokinetic bridges, (4) TNT-like structures, and (5) bundles of TNT-like structures. (D) Representative images of CEP55-positive cytokinetic bridges and CEP55-negative TNT-like connections. (E) Length distribution and average lengths between CEP55-positive (n = 27 connections, mean 5.6 μm) and CEP55-negative connections (n = 114 connections, mean 7.8 μm), p = 0.0096, statistical analysis is t test. (F) Relative numbers of CEP55-positive connections and CEP55-negative TNT-like connections having lengths below 5 μm, from 5 to 10 μm, and above 10 μm (n = 141 connections). (G) Representative images of Wnt8a-bearing cytonemes and Wnt8a-negative TNT-like connections. (H) Length distribution and average lengths of Wnt8a-positive (n = 18 connections, mean 9.7 μm) and Wnt8a-negative connections (n = 100 connections, mean 9.4 μm), p = 0.7228, statistical analysis is t test. (I) Relative numbers of Wnt8a-positive cytonemes and Wnt8a-negative TNT-like connections (n = 118 connections). Scale bars are 10 μm. |
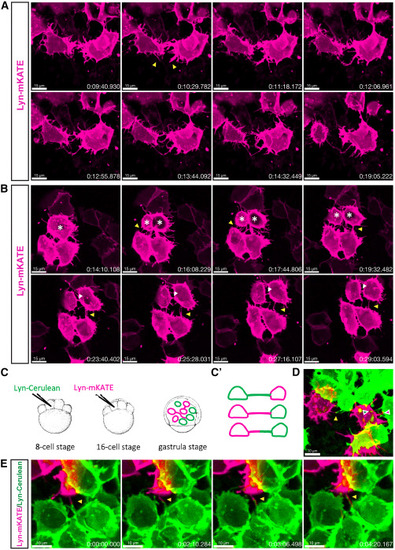
Formation mechanisms of TNT-like connections (A) Time-lapse recording of the zebrafish embryo at 8 hpf shows two neighboring cells extending filopodia (yellow arrowheads) that subsequently merge into a single membranous connection that remains stable for at least 5 min. (B) Time-lapse recording of the zebrafish embryo at 8 hpf shows three neighboring cells forming TNT-like connections through cell dislodgement (yellow arrowhead) while the top cell is dividing (white asterisks). The daughter cells maintain connections with the lower cells for at least 15 min (yellow arrowhead), while a cytokinetic bridge between the daughter cells is also visible (white arrowhead). (C) Schematic representation of the strategy for labeling two cell populations: zebrafish embryo is injected with lyn-Cerulean mRNA into one of the central cells at the 8-cell stage, followed by injection at the 16-cell stage with lyn-mKATE mRNA, and then imaged at the gastrula stage (7–9 hpf). (C′)—Expected labeling outcomes: TNT-like structures formed by either one or both cell populations. (D) Representative image showing connections formed by either one (green and magenta arrowheads) or both (yellow arrowhead) cell populations. (E) Time-lapse recording of the zebrafish embryo at 8 hpf shows two cells belonging to different cell populations extending protrusions (yellow arrowhead) that elongate along each other. Scale bars are 15 μm for (A) and (B), 10 μm for (D) and (E), and time is indicated as h:mm:ss. |
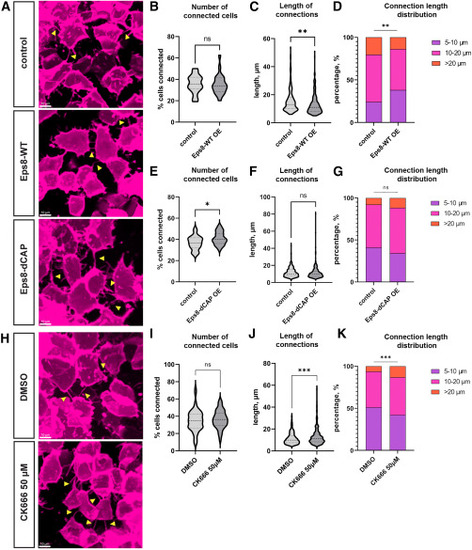
Effect of TNT inducers on zebrafish intercellular connections (A–G) Effect of overexpression of Eps8-WT (A)–(D) and its mutant Eps8-dCAP (A) and (E)–(G). (A) Representative images of the zebrafish embryo cells connected by TNT-like structures (yellow arrowheads), following Eps8-WT and Eps8-dCAP overexpression. Graphs (B) and (E) represent relative numbers of connected cells, graphs (C) and (F) show violin plots of lengths of TNT-like connections, and graphs (D) and (G) represent length distributions of TNT-like connections. (B) Control group: n = 15 embryos, median 35.38%; Eps8-WT overexpression group: n = 22 embryos, median 33.77%. p = 0.6521, analyzed using the Mann-Whitney test. (C) Control group: n = 220 connections, mean 15.30 μm; Eps8-WT overexpression group: n = 247 connections, mean 12.99 μm. p = 0.0011, analyzed using a t test. (D) Control group: n = 220 connections; Eps8-WT overexpression group: n = 247 connections, p = 0.0030, analyzed using the chi-squared test. (E) Control group: n = 23 embryos, median 36.71%; Eps8-dCAP overexpression group: n = 28 embryos, median 40.19%. p = 0.0436, analyzed using the Mann-Whitney test. (F) Control group: n = 343 connections, mean 11.77 μm; Eps8-dCAP overexpression group: n = 489 connections, mean 11.20 μm. p = 0.1717, analyzed using a t test. (G) Control group: n = 343 connections; Eps8-dCAP overexpression group: n = 489 connections, p = 0.0516, analyzed using the chi-squared test. (H–K) Effect of CK666 treatment of the embryo on TNT-like connections. (H) Representative images of the zebrafish embryo cells connected by TNT-like structures (yellow arrowheads), following CK666 treatment. (I) Relative numbers of connected cells. DMSO control group: n = 57 embryos, median 34.88%; CK666 50 μM group: n = 44 embryos, median 36.21%, p value is >0.9999, analyzed using the Mann-Whitney test. (J) Average length of TNT-like connections. DMSO control group: n = 541 connections, mean 11.29 μm; CK666 50 μM group: n = 328 connections, mean 12.90 μm, p value is <0.0001, analyzed using a t test. (K) TNT length distribution. DMSO control group: n = 541 connections; CK666 50 μM group: n = 328 connections, p = 0.0008, analyzed using the chi-squared test. |
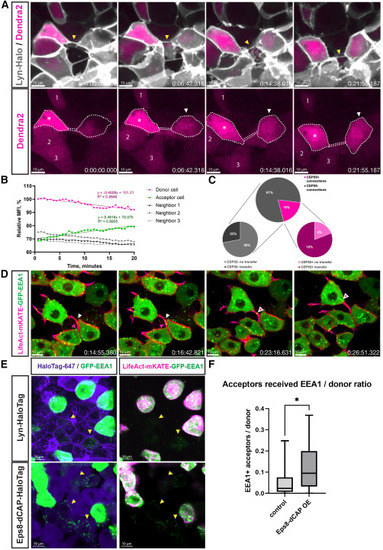
TNT-like structures are able to transfer material (A) Time-lapse recording of the zebrafish embryo at 8 hpf shows two cells connected by a membranous TNT-like connection (yellow arrowhead). Cytoplasmic Dendra2 was photoconverted to red in the cell on the left (white asterisk), the cell on the right (white arrowhead) receives red labeling within 20 min, while the fluorescence intensity of other neighboring cells (1, 2, and 3) is not changed. (B) Relative mean fluorescent intensity (MFI) quantification for time-lapse (A). Linear regression fitting for donor and acceptor cells performed in GraphPad Prism software, with equations and goodness of fit (R2) visualized on the graph. (C) Relative numbers of transferring and non-transferring connections in accordance with the proportions of CEP55-positive cytokinetic bridges and CEP55-negative TNT-like connections (upper chart: n = 141 connections; lower charts: CEP55-negative n = 25 connections, CEP55-positive n = 21 connections). (D) Time-lapse recording of the zebrafish embryo at 8 hpf shows two cells connected by an actin-positive TNT-like connection, which enables the transfer of early endosomes. The white arrowhead points the vesicles that were already present in the connection at the beginning of the recording, while the magenta arrowhead points the vesicles that entered the connection from the connected cell below. (E) Representative images showing violet Lyn-HaloTag 647 or Eps8-dCAP-HaloTag 647 acceptor cells containing green dots of EEA1-positive vesicles (yellow arrowheads). The green signal in the left panels was enhanced compared to the right panels to better visualize vesicles in the acceptor cells. (F) Quantification of the relative amount of acceptor cells (normalized to the amount of donor cells) that received EEA1-positive vesicles. Control group: n = 17 embryos, median 0.02344, Eps8-dCAP overexpression group: n = 18 embryos, median 0.09467. p = 0.0184, analyzed using the Mann-Whitney test. Box lines show medians, box edges represent quartiles, and whiskers - minimal to maximal values. Scale bars are 10 μm; time is indicated as: h:mm:ss. |
Reprinted from Developmental Cell, , Korenkova, O., Liu, S., Prlesi, I., Pepe, A., Albadri, S., Del Bene, F., Zurzolo, C., Tunneling nanotubes enable intercellular transfer in zebrafish embryos, , Copyright (2024) with permission from Elsevier. Full text @ Dev. Cell