
- Title
-
NIMA-related kinase 9 regulates the phosphorylation of the essential myosin light chain in the heart
- Authors
- Müller, M., Eghbalian, R., Boeckel, J.N., Frese, K.S., Haas, J., Kayvanpour, E., Sedaghat-Hamedani, F., Lackner, M.K., Tugrul, O.F., Ruppert, T., Tappu, R., Martins Bordalo, D., Kneuer, J.M., Piekarek, A., Herch, S., Schudy, S., Keller, A., Grammes, N., Bischof, C., Klinke, A., Cardoso-Moreira, M., Kaessmann, H., Katus, H.A., Frey, N., Steinmetz, L.M., Meder, B.
- Source
- Full text @ Nat. Commun.
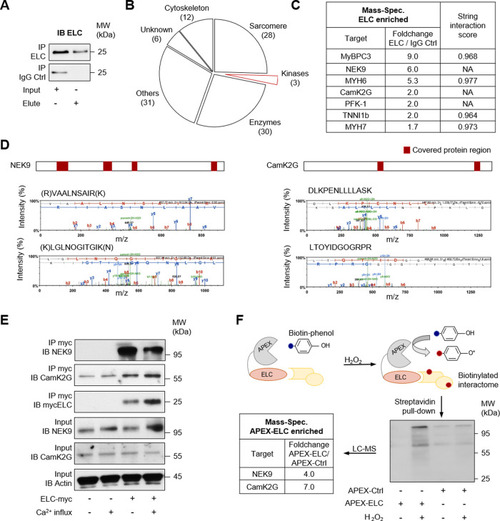
Immunoprecipitation (IP) was performed by using custom ELC antibodies covalently coupled to magnetic beads. Liquid chromatography followed by mass spectrometry (LC-MS) was used for identification. |
|
|
|
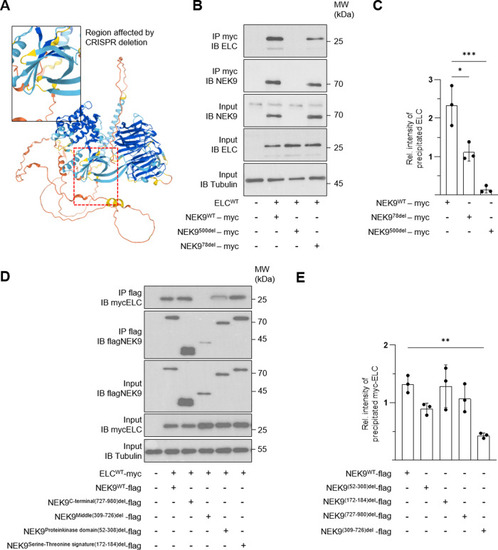
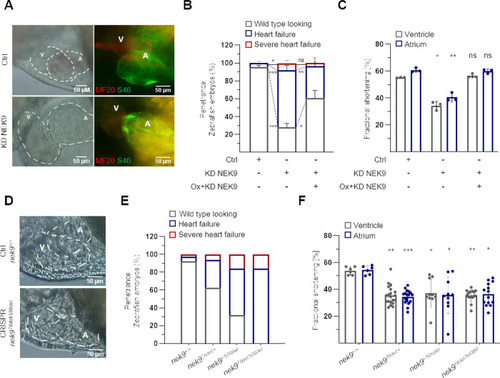
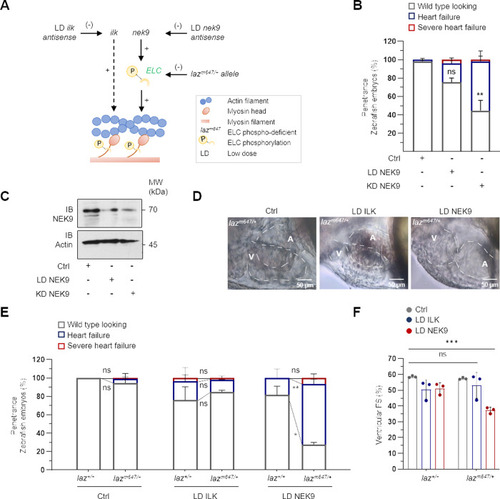
Two heterozygous transgenic zebrafish lines were generated by CRISPR/Cas9. |
|
|
|