
|
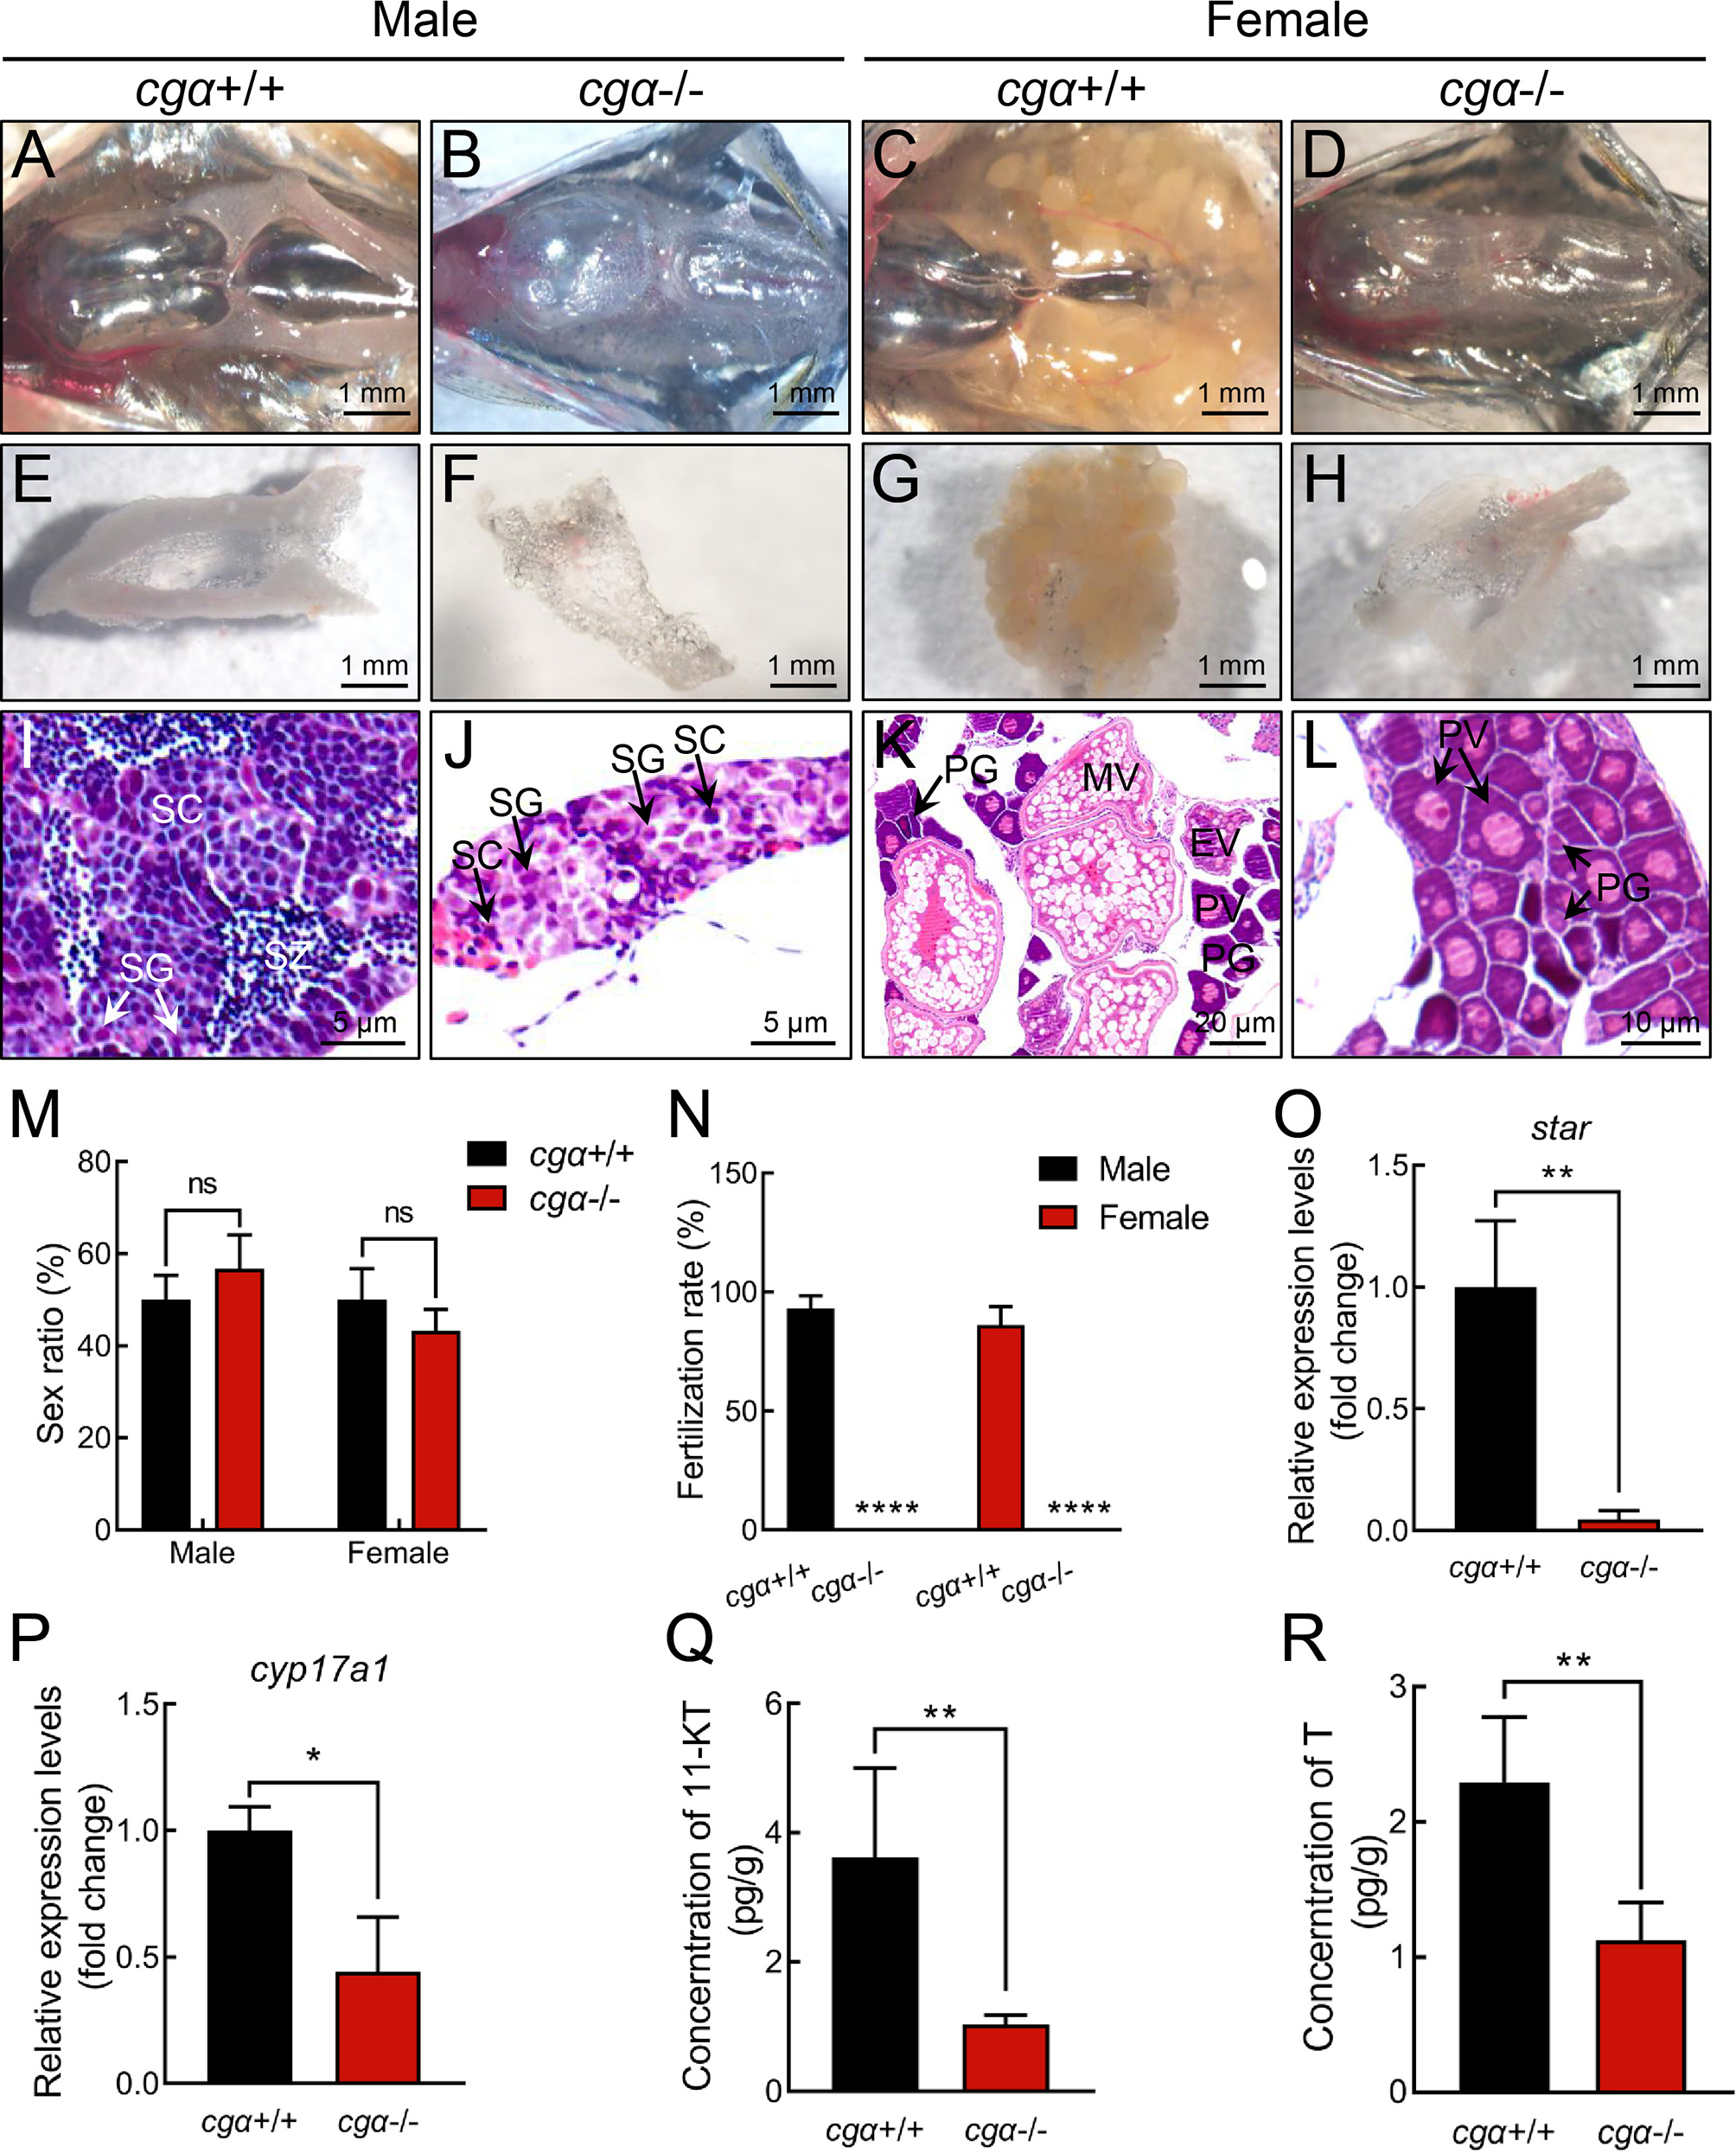
Fig. 5 Gonadal hypoplasia in cgα-deficient zebrafish at 4 mpf A–D: Anatomical examination of gonads from control siblings (A, male; C, female) and cgα-deficient fish (B, male; D, female) at 4 mpf. E–H: Dissected gonadal tissues of control siblings (E, male; G, female) and cgα-deficient fish (F, male; H, female) at 4 mpf. I–L: Histological analysis of gonadal tissues from control siblings (I, male; K, female) and cgα-deficient (J, male; L, female) fish at 4 mpf. M: Sex ratio of control siblings and cgα-deficient fish at 4 mpf (n=20). N: Fertilization ratio of control siblings and cgα-deficient fish at 4 mpf when paired with WT fish of the opposite sex (n=8/group). O, P: Expression levels of star (O) and cyp17a1 (P) in testis tissue of control siblings and cgα-deficient fish at 4 mpf. Q, R: Levels of 11-KT (Q) and testosterone (R) from whole-body lysates of cgα-deficient male fish and control male siblings at 4 mpf. SG, spermatogonia; SC, spermatocytes; SZ, spermatozoa; PG, primary growth follicle; PV, previtellogenic follicle; EV, early vitellogenic follicle; MV, middle vitellogenic follicle; 11-KT, 11-ketotestosterone; T, testosterone. ns: Not significant; *: P<0.05; **: P<0.01; ****: P<0.0001.