
|
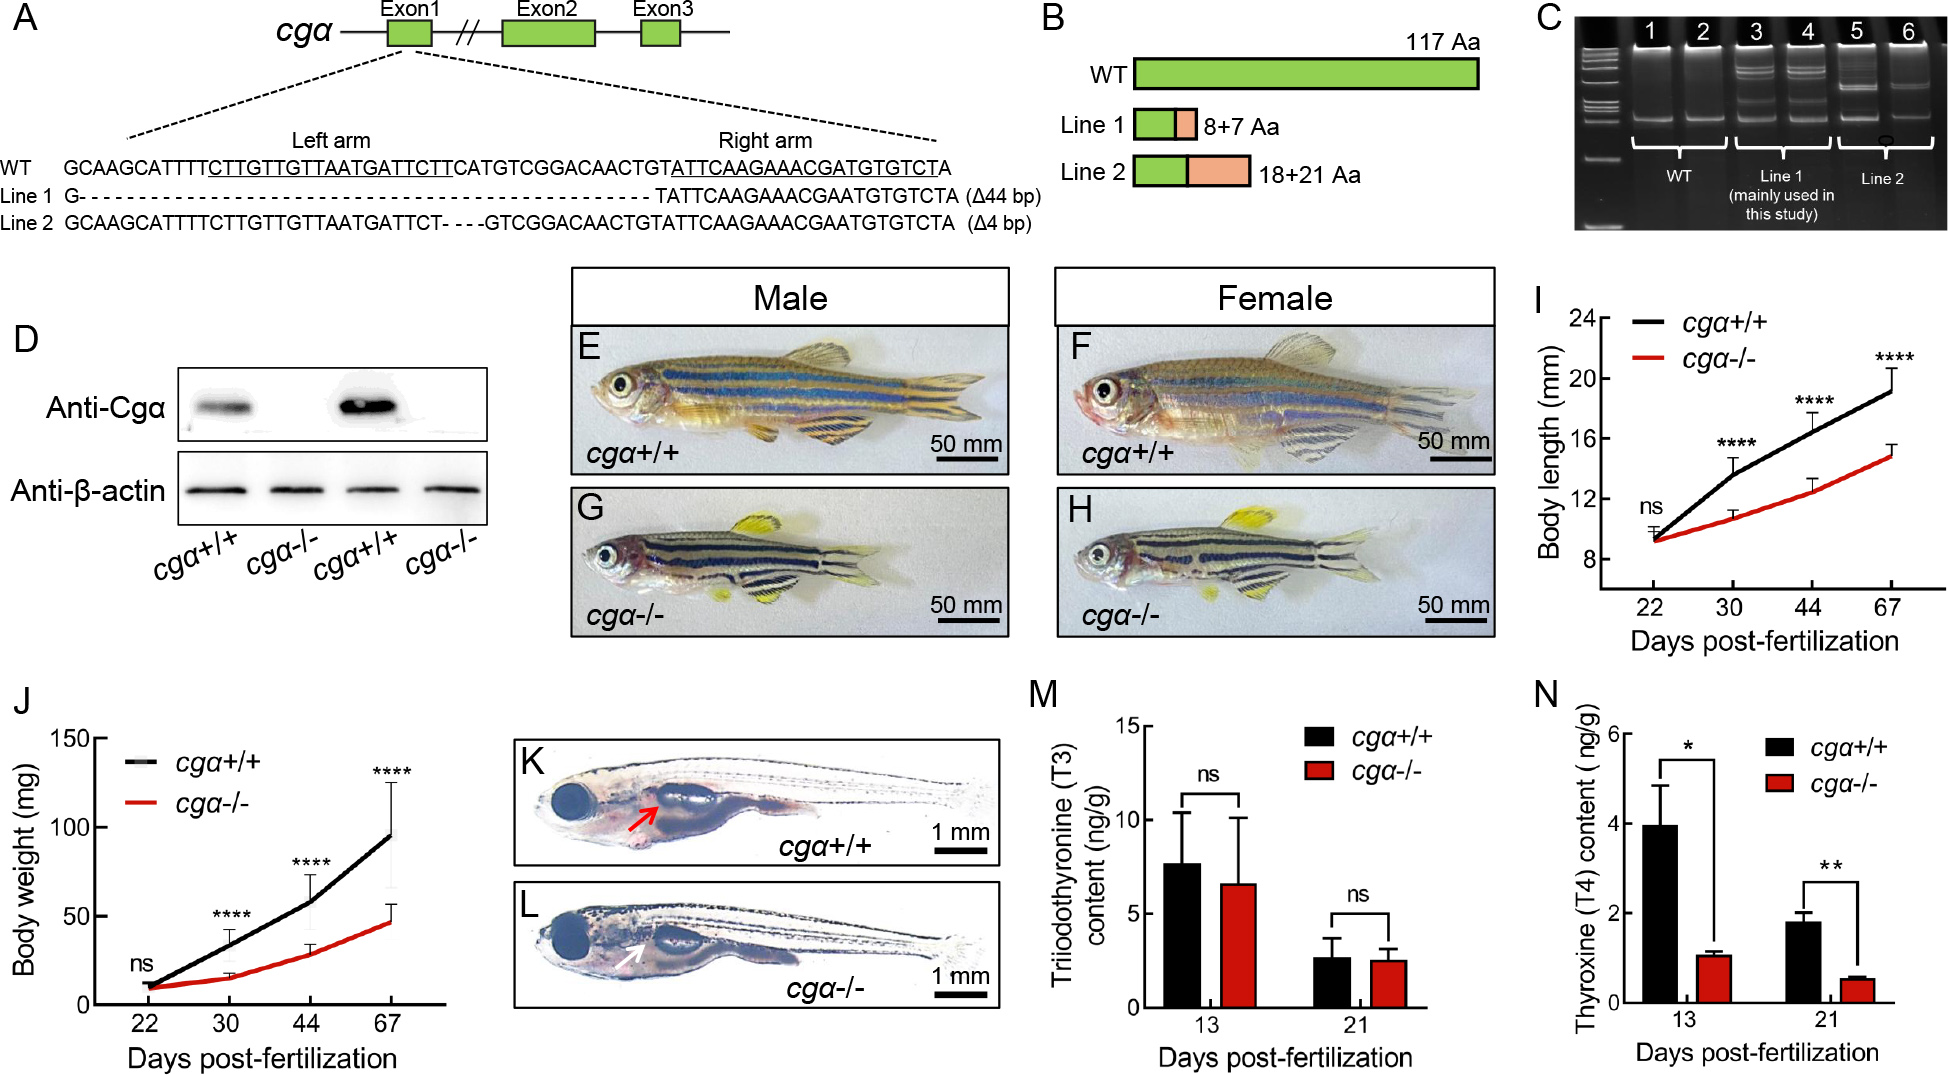
Fig. 1 Generation and characterization of cgα-deficient zebrafish using TALENs A: Schematic of TALEN-mediated editing at exon 1 of the cgα locus. Underlined sequences denote the two targeting arms of TALENs. B: Diagram of WT and two truncated mutant Cgα proteins in zebrafish. Green regions represent amino acid sequences identical to WT, while orange regions indicate mismatched residues. C: Heteroduplex-based genotyping of cgα in cgα+/+ control fish (Lanes 1 and 2) and cgα+/− fish (Lanes 3 and 4 for mutant line 1; Lanes 5 and 6 for mutant line 2), amplified products from tail gDNA samples. D: Western blot analysis of Cgα in pituitary samples from control and mutant lines of cgα-deficient male zebrafish. E–H: Gross appearance of control siblings (E, control male; F, control female) and cgα-deficient fish (G, mutant male; H, mutant female) at 4 mpf. I, J: Body length (I) and weight (J) of control siblings and cgα-deficient fish from juvenile to adult stages. K, L: Gross appearance of control sibling (K) and cgα-deficient fish (L) at 16 dpf. Red arrow indicates inflated anterior swim bladder of control fish, white arrow indicates undeveloped anterior swim bladder of cgα-deficient fish. M, N: Levels of triiodothyronine (T3, M) and thyroxine (T4, N) in bodies of control and cgα-deficient fish at 13 and 21 dpf stages. ns: Not significant; *: P<0.05; **: P<0.01; ****: P<0.0001.