IMAGE

Fig. 4

ID
ZDB-IMAGE-250528-57
Source
Figures for Wang et al., 2025
Image
Figure Caption

Fig. 4

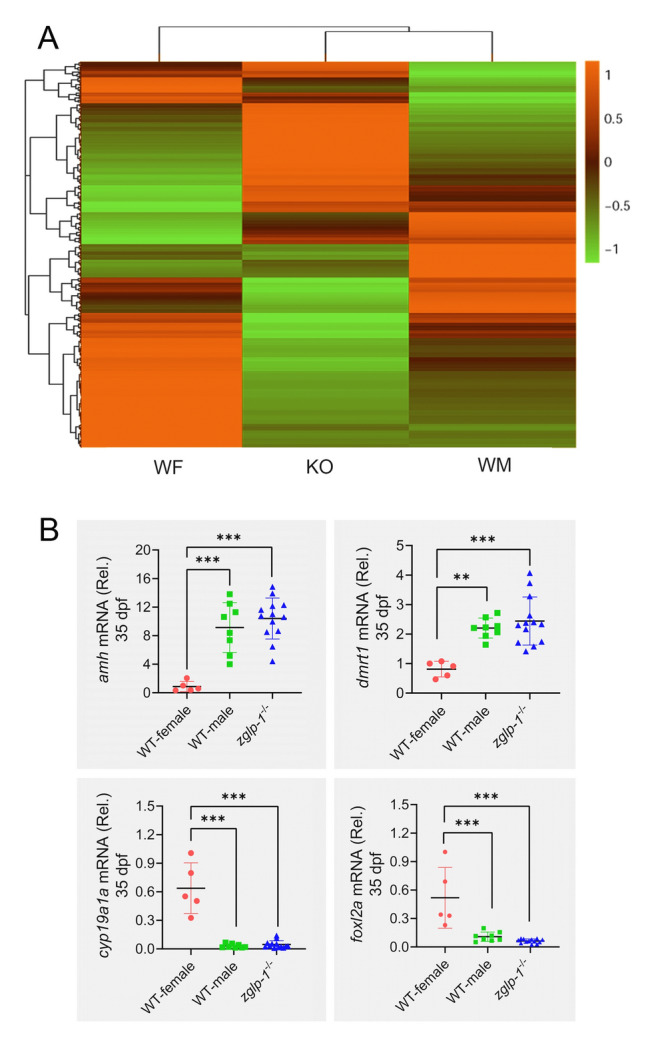
zglp-1−/− mutants show a male expression profile. A A cluster analysis was conducted to identify differentially expressed genes among the three distinct groups: zglp-1−/− zebrafish (KO), wild-type male zebrafish (WM), and wild-type female zebrafish (WF). B A comparative analysis was performed to assess the expression levels of amh, dmrt1, cyp19a1a, and foxl2a genes in WM, WF, and zglp-1/− zebrafish at 35 dpf. actb1 was used as a control. Data are presented as mean ± SD. The data were subjected to statistical analysis using one-way ANOVA (**P < 0.01, ***P < 0.001)

Acknowledgments
This image is the copyrighted work of the attributed author or publisher, and ZFIN has permission only to display this image to its users. Additional permissions should be obtained from the applicable author or publisher of the image. Full text @ Mar Life Sci Technol