
Image
|
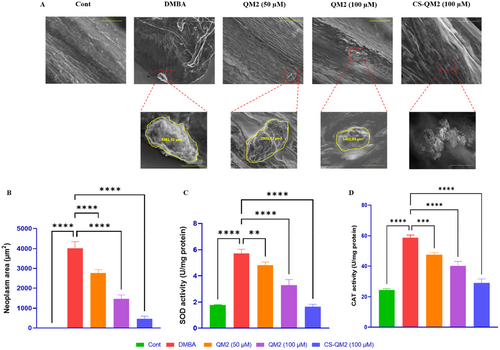
Figure Caption
Fig. 7 Representation of the morphological analysis and biochemical markers in zebrafish larvae. (A) SEM analysis of neoplasm occurrence in zebrafish larvae. Statistical representation of (B) neoplasm area, (C) SOD level, and (D) CAT level in zebrafish larvae. Data are presented as mean ± standard deviation of replicates. The asterix represents the statistical significance compared to the DMBA group. Scale bar: 50 µm and 10 µm.
Acknowledgments
This image is the copyrighted work of the attributed author or publisher, and
ZFIN has permission only to display this image to its users.
Additional permissions should be obtained from the applicable author or publisher of the image.
Full text @ J. Biochem. Mol. Toxicol.